APS 2011 Annual Report Download - page 173
Download and view the complete annual report
Please find page 173 of the 2011 APS annual report below. You can navigate through the pages in the report by either clicking on the pages listed below, or by using the keyword search tool below to find specific information within the annual report.-
 1
1 -
2
-
3
-
4
-
5
-
6
-
7
-
8
-
9
-
10
-
11
-
12
-
13
-
14
-
15
-
16
-
17
-
18
-
19
-
20
-
21
-
22
-
23
-
24
-
25
-
26
-
27
-
28
-
29
-
30
-
31
-
32
-
33
-
34
-
35
-
36
-
37
-
38
-
39
-
40
-
41
-
42
-
43
-
44
-
45
-
46
-
47
-
48
-
49
-
50
-
51
-
52
-
53
-
54
-
55
-
56
-
57
-
58
-
59
-
60
-
61
-
62
-
63
-
64
-
65
-
66
-
67
-
68
-
69
-
70
-
71
-
72
-
73
-
74
-
75
-
76
-
77
-
78
-
79
-
80
-
81
-
82
-
83
-
84
-
85
-
86
-
87
-
88
-
89
-
90
-
91
-
92
-
93
-
94
-
95
-
96
-
97
-
98
-
99
-
100
-
101
-
102
-
103
-
104
-
105
-
106
-
107
-
108
-
109
-
110
-
111
-
112
-
113
-
114
-
115
-
116
-
117
-
118
-
119
-
120
-
121
-
122
-
123
-
124
-
125
-
126
-
127
-
128
-
129
-
130
-
131
-
132
-
133
-
134
-
135
-
136
-
137
-
138
-
139
-
140
-
141
-
142
-
143
-
144
-
145
-
146
-
147
-
148
-
149
-
150
-
151
-
152
-
153
-
154
-
155
-
156
-
157
-
158
-
159
-
160
-
161
-
162
-
 163
163 -
 164
164 -
 165
165 -
 166
166 -
 167
167 -
 168
168 -
 169
169 -
 170
170 -
 171
171 -
 172
172 -
 173
173 -
 174
174 -
 175
175 -
 176
176 -
 177
177 -
 178
178 -
 179
179 -
 180
180 -
 181
181 -
 182
182 -
 183
183 -
184
-
185
-
186
-
187
-
188
-
189
-
190
-
191
-
192
-
193
-
194
-
195
-
196
-
197
-
198
-
199
-
200
-
201
-
202
-
203
-
204
-
205
-
206
-
207
-
208
-
209
-
210
-
211
-
212
-
213
-
214
-
215
-
216
-
217
-
218
-
219
-
220
-
221
-
222
-
223
-
224
-
225
-
226
-
227
-
228
-
229
-
230
-
231
-
232
-
233
-
234
-
235
-
236
-
237
-
238
-
239
-
240
-
241
-
242
-
243
-
244
-
245
-
246
-
247
-
248
 |
 |

PINNACLE WEST CAPITAL CORPORATION
NOTES TO CONSOLIDATED FINANCIAL STATEMENTS
148
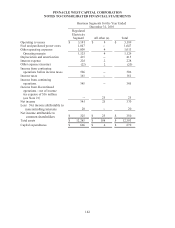
2011 2010 2009
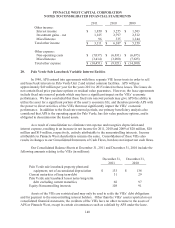
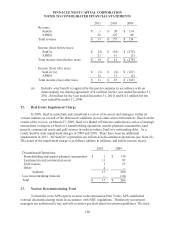
Other income:
Interest income $ 1,850 $ 3,255 $ 1,503
Investment gains – net 1,165 2,797 2,512
Miscellaneous 96 335 1,144
Total other income $ 3,111 $ 6,387 $ 5,159
Other expense:
Non-operating costs $ (7,037) $ (6,831) $ (6,675)
Miscellaneous (3,414) (3,090) (7,625)
Total other expense $ (10,451) $ (9,921) $ (14,300)
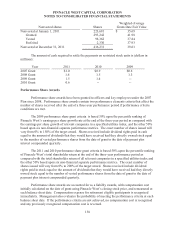
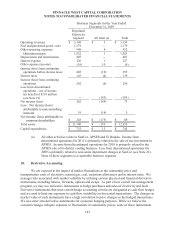
20. Palo Verde Sale Leaseback Variable Interest Entities
In 1986, APS entered into agreements with three separate VIE lessor trusts in order to sell
and lease back interests in Palo Verde Unit 2 and related common facilities. APS will pay
approximately $49 million per year for the years 2011 to 2015 related to these leases. The leases do
not contain fixed price purchase options or residual value guarantees. However, the lease agreements
include fixed rate renewal periods which may have a significant impact on the VIEs’ economic
performance. We have concluded that these fixed rate renewal periods may give APS the ability to
utilize the asset for a significant portion of the asset’s economic life, and therefore provide APS with
the power to direct activities of the VIEs that most significantly impact the VIEs’ economic
performance. In addition to the fixed rate renewal periods, our primary beneficiary analysis also
considered that APS is the operating agent for Palo Verde, has fair value purchase options, and is
obligated to decommission the leased assets.
As a result of consolidation we eliminate rent expense and recognize depreciation and
interest expense, resulting in an increase in net income for 2011, 2010 and 2009 of $28 million, $20
million and $19 million, respectively, entirely attributable to the noncontrolling interests. Income
attributable to Pinnacle West shareholders remains the same. Consolidation of these VIEs also
results in changes to our Consolidated Statements of Cash Flows, but does not impact net cash flows.
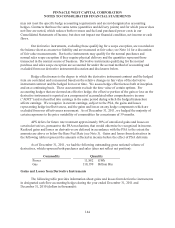
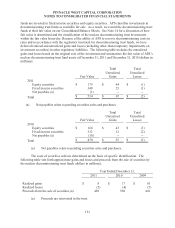
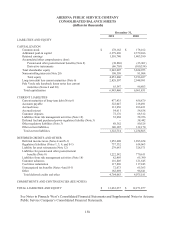
Our Consolidated Balance Sheets at December 31, 2011 and December 31, 2010 include the
following amounts relating to the VIEs (in millions):
December 31,
2011
December 31,
2010
Palo Verde sale leaseback property plant and
equipment, net of accumulated depreciation $ 133 $ 138
Current maturities of long term-debt 31 29
Palo Verde sale leaseback lessor notes long-term
debt excluding current maturities 66 97
Equity-Noncontrolling interests 108 91
Assets of the VIEs are restricted and may only be used to settle the VIEs’ debt obligations
and for payment to the noncontrolling interest holders. Other than the VIEs’ assets reported on our
consolidated financial statements, the creditors of the VIEs have no other recourse to the assets of
APS or Pinnacle West, except in certain circumstances such as a default by APS under the lease.