APS 2011 Annual Report Download - page 21
Download and view the complete annual report
Please find page 21 of the 2011 APS annual report below. You can navigate through the pages in the report by either clicking on the pages listed below, or by using the keyword search tool below to find specific information within the annual report.-
 1
1 -
2
-
3
-
4
-
5
-
6
-
7
-
8
-
9
-
10
-
 11
11 -
 12
12 -
 13
13 -
 14
14 -
 15
15 -
 16
16 -
 17
17 -
 18
18 -
 19
19 -
 20
20 -
 21
21 -
 22
22 -
 23
23 -
 24
24 -
 25
25 -
 26
26 -
 27
27 -
 28
28 -
 29
29 -
 30
30 -
 31
31 -
32
-
33
-
34
-
35
-
36
-
37
-
38
-
39
-
40
-
41
-
42
-
43
-
44
-
45
-
46
-
47
-
48
-
49
-
50
-
51
-
52
-
53
-
54
-
55
-
56
-
57
-
58
-
59
-
60
-
61
-
62
-
63
-
64
-
65
-
66
-
67
-
68
-
69
-
70
-
71
-
72
-
73
-
74
-
75
-
76
-
77
-
78
-
79
-
80
-
81
-
82
-
83
-
84
-
85
-
86
-
87
-
88
-
89
-
90
-
91
-
92
-
93
-
94
-
95
-
96
-
97
-
98
-
99
-
100
-
101
-
102
-
103
-
104
-
105
-
106
-
107
-
108
-
109
-
110
-
111
-
112
-
113
-
114
-
115
-
116
-
117
-
118
-
119
-
120
-
121
-
122
-
123
-
124
-
125
-
126
-
127
-
128
-
129
-
130
-
131
-
132
-
133
-
134
-
135
-
136
-
137
-
138
-
139
-
140
-
141
-
142
-
143
-
144
-
145
-
146
-
147
-
148
-
149
-
150
-
151
-
152
-
153
-
154
-
155
-
156
-
157
-
158
-
159
-
160
-
161
-
162
-
163
-
164
-
165
-
166
-
167
-
168
-
169
-
170
-
171
-
172
-
173
-
174
-
175
-
176
-
177
-
178
-
179
-
180
-
181
-
182
-
183
-
184
-
185
-
186
-
187
-
188
-
189
-
190
-
191
-
192
-
193
-
194
-
195
-
196
-
197
-
198
-
199
-
200
-
201
-
202
-
203
-
204
-
205
-
206
-
207
-
208
-
209
-
210
-
211
-
212
-
213
-
214
-
215
-
216
-
217
-
218
-
219
-
220
-
221
-
222
-
223
-
224
-
225
-
226
-
227
-
228
-
229
-
230
-
231
-
232
-
233
-
234
-
235
-
236
-
237
-
238
-
239
-
240
-
241
-
242
-
243
-
244
-
245
-
246
-
247
-
248
 |
 |

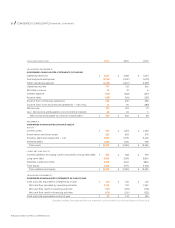
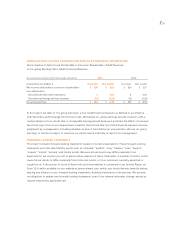
PINNACLE WEST C APITA L CORPORATION NON-GAAP FINANCIAL I N FORMATION
Reconciliation of Net Income Attributable to Common Shareholders (GAAP Measure)
to On-going Earnings (Non-GAAP Financial Measure)
In this report, we refer to “on-going earnings,” a non-GAAP nancial measure as dened in accordance
with Securities and Exchange Commission rules. We believe on-going earnings provide investors with a
useful indicator of our results that is comparable among periods because it excludes the eects of unusual
items that may occur on an irregular basis. Investors should note that non-GAAP nancial measures involve
judgments by management, including whether an item is classied as an unusual item. We use on-going
earnings, or similar concepts, to measure our performance internally in reports for management.
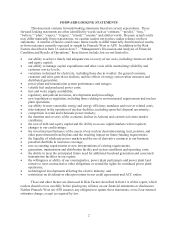
FORWARD-LOOKING STATEMENTS
This report contains forward-looking statements based on current expectations. These forward-looking
statements are often identied by words such as “estimate,” “predict,” “may,” “believe,” “plan,” “expect,”
“require,” “intend,” “assume” and similar words. Because actual results may dier materially from
expectations, we caution you not to place undue reliance on these statements. A number of factors could
cause future results to dier materially from historical results, or from outcomes currently expected or
sought by us. A discussion of some of these risks and uncertainties is contained in our Annual Report on
Form 10-K and is available on our website at pinnaclewest.com, which you should review carefully before
placing any reliance on our forward-looking statements, nancial statements or disclosures. We assume
no obligation to update any forward-looking statements, even if our internal estimates change, except as
may be required by applicable law.
(DOLLARS IN MILLIONS, EXCEPT PER SHARE AMOUNTS) 2011 2010
YEAR ENDED DECEMBER 31, MILLIONS PER SHARE MILLIONS PER SHARE
Net income attributable to common shareholders $ 339 $ 3.09 $ 350 $ 3.27
Less adjustments:
Discontinued real estate operations 1 0.01 6 0.05
Discontinued energy services business (12 ) (0.11 ) (31 ) (0.29 )
On-going earnings $ 328 $ 2.99 $ 325 $ 3.03
/ 19