APS 2011 Annual Report Download - page 8
Download and view the complete annual report
Please find page 8 of the 2011 APS annual report below. You can navigate through the pages in the report by either clicking on the pages listed below, or by using the keyword search tool below to find specific information within the annual report.-
 1
1 -
 2
2 -
 3
3 -
 4
4 -
 5
5 -
 6
6 -
 7
7 -
 8
8 -
 9
9 -
 10
10 -
 11
11 -
 12
12 -
 13
13 -
 14
14 -
 15
15 -
 16
16 -
 17
17 -
 18
18 -
 19
19 -
20
-
21
-
22
-
23
-
24
-
25
-
26
-
27
-
28
-
29
-
30
-
31
-
32
-
33
-
34
-
35
-
36
-
37
-
38
-
39
-
40
-
41
-
42
-
43
-
44
-
45
-
46
-
47
-
48
-
49
-
50
-
51
-
52
-
53
-
54
-
55
-
56
-
57
-
58
-
59
-
60
-
61
-
62
-
63
-
64
-
65
-
66
-
67
-
68
-
69
-
70
-
71
-
72
-
73
-
74
-
75
-
76
-
77
-
78
-
79
-
80
-
81
-
82
-
83
-
84
-
85
-
86
-
87
-
88
-
89
-
90
-
91
-
92
-
93
-
94
-
95
-
96
-
97
-
98
-
99
-
100
-
101
-
102
-
103
-
104
-
105
-
106
-
107
-
108
-
109
-
110
-
111
-
112
-
113
-
114
-
115
-
116
-
117
-
118
-
119
-
120
-
121
-
122
-
123
-
124
-
125
-
126
-
127
-
128
-
129
-
130
-
131
-
132
-
133
-
134
-
135
-
136
-
137
-
138
-
139
-
140
-
141
-
142
-
143
-
144
-
145
-
146
-
147
-
148
-
149
-
150
-
151
-
152
-
153
-
154
-
155
-
156
-
157
-
158
-
159
-
160
-
161
-
162
-
163
-
164
-
165
-
166
-
167
-
168
-
169
-
170
-
171
-
172
-
173
-
174
-
175
-
176
-
177
-
178
-
179
-
180
-
181
-
182
-
183
-
184
-
185
-
186
-
187
-
188
-
189
-
190
-
191
-
192
-
193
-
194
-
195
-
196
-
197
-
198
-
199
-
200
-
201
-
202
-
203
-
204
-
205
-
206
-
207
-
208
-
209
-
210
-
211
-
212
-
213
-
214
-
215
-
216
-
217
-
218
-
219
-
220
-
221
-
222
-
223
-
224
-
225
-
226
-
227
-
228
-
229
-
230
-
231
-
232
-
233
-
234
-
235
-
236
-
237
-
238
-
239
-
240
-
241
-
242
-
243
-
244
-
245
-
246
-
247
-
248
 |
 |

PINNACLE WEST CAPITAL CORPORATION
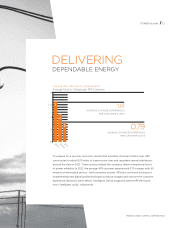
PRACTICE FINANCIAL D I SCIPLI N E
Pinnacle West achieved solid nancial results again in 2011. The company earned net income of $339
million or $3.09 per share, compared with $350 million or $3.27 per share the previous year. Ongoing
earnings amounted to $2.99 per share, which represents a slight decrease from 2010.
Pinnacle West’s total return to shareholders – a combination of stock price appreciation and dividends
paid – reached 22 percent. Our results slightly bettered the return for the S&P 1500 Electric Utilities Index
and signicantly outperformed the 2 percent return of the S&P 500 Index.
Pinnacle West’s total return has exceeded market averages for the last one-, two-, three- and ve-year
periods. Pinnacle West’s shareholder value increased nearly $1 billion in 2011 and nearly $2.7 billion over
the past three years.
In June, Standard and Poor’s upgraded its corporate credit ratings for Pinnacle West and APS from
BBB- to BBB. S&P cited the company’s stronger credit metrics, debt reduction, improving regulatory
environment and prudent nancial management. The upgrade allows our company to borrow at lower
interest rates and improves our access to debt markets, thereby reducing our nancing costs for new
infrastructure and system improvement projects.
We continue to narrow our focus to what we do best – run an electric utility. To this end, we sold our
competitive energy services subsidiary, APS Energy Services, in 2011 for a gain of $10 million.
GROW OUR B US INESS AS ARIZONA GROWS
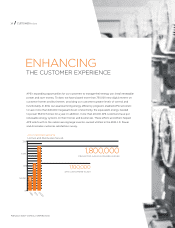
Over the next three years, we expect our customer base to grow an average of 1.6 percent per year as
economic recovery takes hold. We project that growth will return to Arizona’s traditional levels over the
long term, resulting in 2.6 percent compound annual customer growth through 2030. That equates to
approximately 1.8 million customers then, up from 1.1 million today. Our investment in Arizona’s future
goes well beyond the electricity grid. According to an economic impact report prepared by Arizona State
University’s W.P. Carey School of Business, APS’s business activity contributed $3.4 billion to the Arizona
economy in 2010 and supported 39,000 Arizona jobs. APS also has the distinction of being Arizona’s largest
taxpayer. The company paid $400 million in taxes to the state and to municipal governments in 2010.
Our impact does not end there. APS employees and their families volunteered 157,000 hours to worthwhile
community organizations, which translated into $3.3 million in service to the community. Our employees also
support our communities through the annual Community Services Fund campaign, which benets United
Way and other local non-prot agencies. APS employees contributed $4 million to the community in 2011.
6 / LETTER TO SHAREHOLDERS