APS 2011 Annual Report Download - page 84
Download and view the complete annual report
Please find page 84 of the 2011 APS annual report below. You can navigate through the pages in the report by either clicking on the pages listed below, or by using the keyword search tool below to find specific information within the annual report.-
 1
1 -
2
-
3
-
4
-
5
-
6
-
7
-
8
-
9
-
10
-
11
-
12
-
13
-
14
-
15
-
16
-
17
-
18
-
19
-
20
-
21
-
22
-
23
-
24
-
25
-
26
-
27
-
28
-
29
-
30
-
31
-
32
-
33
-
34
-
35
-
36
-
37
-
38
-
39
-
40
-
41
-
42
-
43
-
44
-
45
-
46
-
47
-
48
-
49
-
50
-
51
-
52
-
53
-
54
-
55
-
56
-
57
-
58
-
59
-
60
-
61
-
62
-
63
-
64
-
65
-
66
-
67
-
68
-
69
-
70
-
71
-
72
-
73
-
 74
74 -
 75
75 -
 76
76 -
 77
77 -
 78
78 -
 79
79 -
 80
80 -
 81
81 -
 82
82 -
 83
83 -
 84
84 -
 85
85 -
 86
86 -
 87
87 -
 88
88 -
 89
89 -
 90
90 -
 91
91 -
 92
92 -
 93
93 -
 94
94 -
95
-
96
-
97
-
98
-
99
-
100
-
101
-
102
-
103
-
104
-
105
-
106
-
107
-
108
-
109
-
110
-
111
-
112
-
113
-
114
-
115
-
116
-
117
-
118
-
119
-
120
-
121
-
122
-
123
-
124
-
125
-
126
-
127
-
128
-
129
-
130
-
131
-
132
-
133
-
134
-
135
-
136
-
137
-
138
-
139
-
140
-
141
-
142
-
143
-
144
-
145
-
146
-
147
-
148
-
149
-
150
-
151
-
152
-
153
-
154
-
155
-
156
-
157
-
158
-
159
-
160
-
161
-
162
-
163
-
164
-
165
-
166
-
167
-
168
-
169
-
170
-
171
-
172
-
173
-
174
-
175
-
176
-
177
-
178
-
179
-
180
-
181
-
182
-
183
-
184
-
185
-
186
-
187
-
188
-
189
-
190
-
191
-
192
-
193
-
194
-
195
-
196
-
197
-
198
-
199
-
200
-
201
-
202
-
203
-
204
-
205
-
206
-
207
-
208
-
209
-
210
-
211
-
212
-
213
-
214
-
215
-
216
-
217
-
218
-
219
-
220
-
221
-
222
-
223
-
224
-
225
-
226
-
227
-
228
-
229
-
230
-
231
-
232
-
233
-
234
-
235
-
236
-
237
-
238
-
239
-
240
-
241
-
242
-
243
-
244
-
245
-
246
-
247
-
248
 |
 |

60
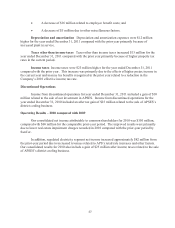
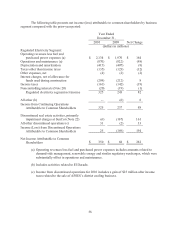
Interest charges, net of allowance for funds used during construction Interest charges, net
of allowance for funds used during construction, decreased $8 million for the year ended 2010
compared with the prior year primarily because of higher rates in the current year for the allowance for
equity and borrowed funds used during construction, partially offset by higher interest charges due to
higher debt balances. Interest charges, net of allowance for funds used during construction are
comprised of the regulated electricity segment portions of the line items interest expense and allowance
for equity and borrowed funds used during construction from the Consolidated Statements of Income.
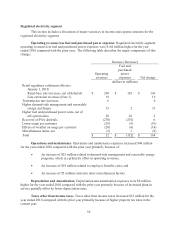
Income taxes Income taxes were $19 million higher for the year ended 2010 compared with
the prior year primarily because of higher pretax income in the current-year period, partially offset by
$17 million of income tax benefits related to prior years that were resolved in the current year. See
Note 4.
All other All other increased $6 million primarily as a result of higher other income due to
investment losses at El Dorado in 2009.
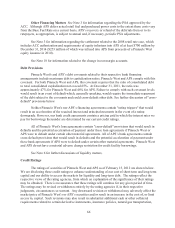
Discontinued Operations
Real estate activities During the first quarter of 2009, SunCor’s Board of Directors authorized
a series of strategic transactions to dispose of SunCor’s assets. This decision resulted in impairment
charges of approximately $161 million after income taxes in 2009. As of December 31, 2010, all of
SunCor’s operations have been reclassified to discontinued operations (see Note 21). The after-tax
impacts of the $6 million loss from real estate activities for the year ended 2010 includes real estate
impairment charges of approximately $10 million (see Note 22) and other costs of $6 million, partially
offset by a gain from debt restructuring of approximately $10 million.
All other All other earnings from discontinued operations were $33 million higher for the year
ended 2010 compared to the prior-year period primarily because of a gain of $25 million after income
taxes related to the sale of APSES’s district cooling business in 2010.
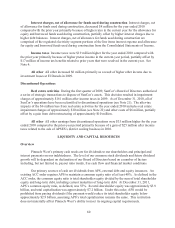
LIQUIDITY AND CAPITAL RESOURCES
Overview
Pinnacle West’s primary cash needs are for dividends to our shareholders and principal and
interest payments on our indebtedness. The level of our common stock dividends and future dividend
growth will be dependent on declaration of our Board of Directors based on a number of factors
including, but not limited to, payout ratio trends, free cash flow and financial market conditions.
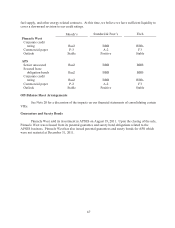
Our primary sources of cash are dividends from APS, external debt and equity issuances. An
existing ACC order requires APS to maintain a common equity ratio of at least 40%. As defined in the
ACC order, the common equity ratio is total shareholder equity divided by the sum of total shareholder
equity and long-term debt, including current maturities of long-term debt. At December 31, 2011,
APS’s common equity ratio, as defined, was 55%. Its total shareholder equity was approximately $3.9
billion, and total capitalization was approximately $7.2 billion. Under this order, APS would be
prohibited from paying dividends if the payment would reduce its total shareholder equity below
approximately $2.9 billion, assuming APS’s total capitalization remains the same. This restriction
does not materially affect Pinnacle West’s ability to meet its ongoing capital requirements.