APS 2011 Annual Report Download - page 142
Download and view the complete annual report
Please find page 142 of the 2011 APS annual report below. You can navigate through the pages in the report by either clicking on the pages listed below, or by using the keyword search tool below to find specific information within the annual report.-
 1
1 -
2
-
3
-
4
-
5
-
6
-
7
-
8
-
9
-
10
-
11
-
12
-
13
-
14
-
15
-
16
-
17
-
18
-
19
-
20
-
21
-
22
-
23
-
24
-
25
-
26
-
27
-
28
-
29
-
30
-
31
-
32
-
33
-
34
-
35
-
36
-
37
-
38
-
39
-
40
-
41
-
42
-
43
-
44
-
45
-
46
-
47
-
48
-
49
-
50
-
51
-
52
-
53
-
54
-
55
-
56
-
57
-
58
-
59
-
60
-
61
-
62
-
63
-
64
-
65
-
66
-
67
-
68
-
69
-
70
-
71
-
72
-
73
-
74
-
75
-
76
-
77
-
78
-
79
-
80
-
81
-
82
-
83
-
84
-
85
-
86
-
87
-
88
-
89
-
90
-
91
-
92
-
93
-
94
-
95
-
96
-
97
-
98
-
99
-
100
-
101
-
102
-
103
-
104
-
105
-
106
-
107
-
108
-
109
-
110
-
111
-
112
-
113
-
114
-
115
-
116
-
117
-
118
-
119
-
120
-
121
-
122
-
123
-
124
-
125
-
126
-
127
-
128
-
129
-
130
-
131
-
 132
132 -
 133
133 -
 134
134 -
 135
135 -
 136
136 -
 137
137 -
 138
138 -
 139
139 -
 140
140 -
 141
141 -
 142
142 -
 143
143 -
 144
144 -
 145
145 -
 146
146 -
 147
147 -
 148
148 -
 149
149 -
 150
150 -
 151
151 -
 152
152 -
153
-
154
-
155
-
156
-
157
-
158
-
159
-
160
-
161
-
162
-
163
-
164
-
165
-
166
-
167
-
168
-
169
-
170
-
171
-
172
-
173
-
174
-
175
-
176
-
177
-
178
-
179
-
180
-
181
-
182
-
183
-
184
-
185
-
186
-
187
-
188
-
189
-
190
-
191
-
192
-
193
-
194
-
195
-
196
-
197
-
198
-
199
-
200
-
201
-
202
-
203
-
204
-
205
-
206
-
207
-
208
-
209
-
210
-
211
-
212
-
213
-
214
-
215
-
216
-
217
-
218
-
219
-
220
-
221
-
222
-
223
-
224
-
225
-
226
-
227
-
228
-
229
-
230
-
231
-
232
-
233
-
234
-
235
-
236
-
237
-
238
-
239
-
240
-
241
-
242
-
243
-
244
-
245
-
246
-
247
-
248
 |
 |
PINNACLE WEST CAPITAL CORPORATION
NOTES TO CONSOLIDATED FINANCIAL STATEMENTS
117
assets is reviewed on at least an annual basis. Other investment strategies include the external
management of the plans’ assets, and the prohibition of investments in Pinnacle West securities.
Long-term fixed income assets consist primarily of fixed income debt securities issued by the
U.S. Treasury, other government agencies, and corporations. Long-term fixed income assets may also
include interest rate swaps, U.S. Treasury futures and other instruments. The investment policy does
not provide for a specific mix of long-term fixed income assets, but does require the average credit
rating of such assets to be considered upper medium grade or above. The 2011 year-end long-term
fixed income asset strategy focused on investments in corporate bonds of primarily investment-grade
U.S. issuers and long-term treasuries, with total long-term fixed income assets representing 46% of
total pension plan assets and 46% of other benefit plans assets.
Return-generating assets in the pension plan and other benefit plans target a mix of
approximately 64% U.S. equities, 27% international equities, and 9% alternative investments. The
2011 year-end U.S. equity holdings were invested primarily in large-cap companies in diverse
industries. International equities include investments in emerging and developing markets. Return-
generating assets also include investments in securities through commingled funds in common and
collective trusts. Alternative investments primarily include investments in real estate. The 2011 year-
end return-generating assets represented 54% of total pension plan assets and 54% of other benefit
plans’ assets.
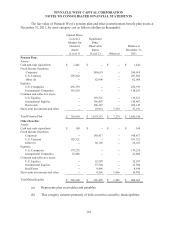
See Note 14 for a discussion on the fair value hierarchy and how fair value methodologies are
applied. The plans invest directly in fixed income and equity securities, in addition to investing
indirectly in equity securities and real estate through the use of common and collective trusts. Equity
securities held directly by the plans are valued using quoted active market prices from the published
exchange on which the equity security trades, and are classified as Level 1. Fixed income securities
issued by the U.S. Treasury held directly by the plans are valued using quoted active market prices, and
are classified as Level 1. Fixed income securities issued by corporations, municipalities, and other
agencies are primarily valued using quoted inactive market prices, or quoted active market prices for
similar securities, or by utilizing calculations which incorporate observable inputs such as yield and
interest rate curves. These instruments are classified as Level 2.
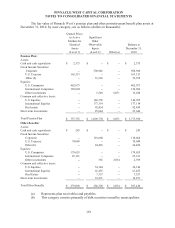
The common and collective trusts, which are similar to mutual funds, are maintained by banks
or investment companies and hold certain investments in accordance with a stated set of objectives
(such as tracking the performance of the S&P 500 index). The common and collective equity trusts are
valued using net asset value (“NAV”), which is derived from the quoted active market prices of the
underlying securities. The plans’ common and collective real estate trust is valued using NAV, which
is derived from the appraised values of the trust’s underlying real estate assets. As of December 31,
2011 the plans were able to transact in the common and collective trusts at NAV and accordingly
classify these investments as Level 2. Because the trust’s shares are offered to a limited group of
investors, they are not considered to be traded in an active market.
The plans’ trustee provides valuation of our plan assets by using pricing services that utilize
methodologies described to determine fair market value. We assess these valuations and verify that
pricing can be supported by actual recent market transactions. Additionally, we obtain and review
independent audit reports on the trustee’s internal operating controls and valuation processes.