APS 2011 Annual Report Download - page 86
Download and view the complete annual report
Please find page 86 of the 2011 APS annual report below. You can navigate through the pages in the report by either clicking on the pages listed below, or by using the keyword search tool below to find specific information within the annual report.-
 1
1 -
2
-
3
-
4
-
5
-
6
-
7
-
8
-
9
-
10
-
11
-
12
-
13
-
14
-
15
-
16
-
17
-
18
-
19
-
20
-
21
-
22
-
23
-
24
-
25
-
26
-
27
-
28
-
29
-
30
-
31
-
32
-
33
-
34
-
35
-
36
-
37
-
38
-
39
-
40
-
41
-
42
-
43
-
44
-
45
-
46
-
47
-
48
-
49
-
50
-
51
-
52
-
53
-
54
-
55
-
56
-
57
-
58
-
59
-
60
-
61
-
62
-
63
-
64
-
65
-
66
-
67
-
68
-
69
-
70
-
71
-
72
-
73
-
74
-
75
-
 76
76 -
 77
77 -
 78
78 -
 79
79 -
 80
80 -
 81
81 -
 82
82 -
 83
83 -
 84
84 -
 85
85 -
 86
86 -
 87
87 -
 88
88 -
 89
89 -
 90
90 -
 91
91 -
 92
92 -
 93
93 -
 94
94 -
 95
95 -
 96
96 -
97
-
98
-
99
-
100
-
101
-
102
-
103
-
104
-
105
-
106
-
107
-
108
-
109
-
110
-
111
-
112
-
113
-
114
-
115
-
116
-
117
-
118
-
119
-
120
-
121
-
122
-
123
-
124
-
125
-
126
-
127
-
128
-
129
-
130
-
131
-
132
-
133
-
134
-
135
-
136
-
137
-
138
-
139
-
140
-
141
-
142
-
143
-
144
-
145
-
146
-
147
-
148
-
149
-
150
-
151
-
152
-
153
-
154
-
155
-
156
-
157
-
158
-
159
-
160
-
161
-
162
-
163
-
164
-
165
-
166
-
167
-
168
-
169
-
170
-
171
-
172
-
173
-
174
-
175
-
176
-
177
-
178
-
179
-
180
-
181
-
182
-
183
-
184
-
185
-
186
-
187
-
188
-
189
-
190
-
191
-
192
-
193
-
194
-
195
-
196
-
197
-
198
-
199
-
200
-
201
-
202
-
203
-
204
-
205
-
206
-
207
-
208
-
209
-
210
-
211
-
212
-
213
-
214
-
215
-
216
-
217
-
218
-
219
-
220
-
221
-
222
-
223
-
224
-
225
-
226
-
227
-
228
-
229
-
230
-
231
-
232
-
233
-
234
-
235
-
236
-
237
-
238
-
239
-
240
-
241
-
242
-
243
-
244
-
245
-
246
-
247
-
248
 |
 |
62
change in collateral and margin cash provided as a result of changes in commodity prices, and other
changes in working capital. In addition, APS’s operating cash flows included income tax payments to
the parent company of approximately $81 million in 2010.
Other Pinnacle West sponsors a qualified defined benefit pension plan and a non-qualified
supplemental excess benefit retirement plan for the employees of Pinnacle West and our subsidiaries.
The requirements of the Employee Retirement Security Act of 1974 (“ERISA”) require us to contribute
a minimum amount to the qualified plan. We contribute at least the minimum amount required under
ERISA regulations, but no more than the maximum tax-deductible amount. The minimum required
funding takes into consideration the value of plan assets and our pension obligation. Under ERISA, the
qualified pension plan was 89% funded as of January 1, 2011 and is estimated to be 85% funded as of
January 1, 2012. The assets in the plan are comprised of fixed-income, equity, real estate, and short-
term investments. Future year contribution amounts are dependent on plan asset performance and plan
actuarial assumptions. The required minimum contribution to our pension plan is $65 million in 2012,
approximately $160 million in 2013 and approximately $160 million in 2014. The contributions to our
other postretirement benefit plans for 2012, 2013 and 2014 are expected to be approximately $20
million each year. In addition, see further discussion in “Critical Accounting Policies – Pension and
Other Postretirement Benefit Accounting” below.
The $69 million long-term income tax receivable on the Consolidated Balance Sheets
represents the anticipated refunds related to an APS tax accounting method change approved by the
Internal Revenue Service (“IRS”) in the third quarter of 2009. This amount is classified as long-term,
as cash refunds are not expected to be received in the next twelve months.
Investing Cash Flows
2011 Compared with 2010 Pinnacle West’s consolidated net cash used for investing activities
was $782 million in 2011, compared to $576 million in 2010, an increase of $206 million in net cash
used. The increase in net cash used for investing activities is primarily due to an increase of $131
million in capital expenditures and a decrease of $126 million in net proceeds from the sales of our
non-utility businesses (see Note 21), partially offset by $55 million of proceeds from the sale of life
insurance policies in 2011.
2010 Compared with 2009 Pinnacle West’s consolidated net cash used for investing activities
was $576 million in 2010, compared to $705 million in 2009, a decrease of $129 million in net cash
used. The decrease in net cash used for investing activities is primarily due to $100 million of
proceeds from the sale of the district cooling business in June 2010 and the increase in proceeds from
the sale of commercial real estate investments of $29 million.
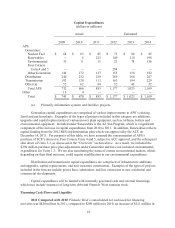
Capital Expenditures The following table summarizes the actual capital expenditures for
2009, 2010 and 2011 and estimated capital expenditures for the next three years: