APS 2011 Annual Report Download - page 140
Download and view the complete annual report
Please find page 140 of the 2011 APS annual report below. You can navigate through the pages in the report by either clicking on the pages listed below, or by using the keyword search tool below to find specific information within the annual report.-
 1
1 -
2
-
3
-
4
-
5
-
6
-
7
-
8
-
9
-
10
-
11
-
12
-
13
-
14
-
15
-
16
-
17
-
18
-
19
-
20
-
21
-
22
-
23
-
24
-
25
-
26
-
27
-
28
-
29
-
30
-
31
-
32
-
33
-
34
-
35
-
36
-
37
-
38
-
39
-
40
-
41
-
42
-
43
-
44
-
45
-
46
-
47
-
48
-
49
-
50
-
51
-
52
-
53
-
54
-
55
-
56
-
57
-
58
-
59
-
60
-
61
-
62
-
63
-
64
-
65
-
66
-
67
-
68
-
69
-
70
-
71
-
72
-
73
-
74
-
75
-
76
-
77
-
78
-
79
-
80
-
81
-
82
-
83
-
84
-
85
-
86
-
87
-
88
-
89
-
90
-
91
-
92
-
93
-
94
-
95
-
96
-
97
-
98
-
99
-
100
-
101
-
102
-
103
-
104
-
105
-
106
-
107
-
108
-
109
-
110
-
111
-
112
-
113
-
114
-
115
-
116
-
117
-
118
-
119
-
120
-
121
-
122
-
123
-
124
-
125
-
126
-
127
-
128
-
129
-
 130
130 -
 131
131 -
 132
132 -
 133
133 -
 134
134 -
 135
135 -
 136
136 -
 137
137 -
 138
138 -
 139
139 -
 140
140 -
 141
141 -
 142
142 -
 143
143 -
 144
144 -
 145
145 -
 146
146 -
 147
147 -
 148
148 -
 149
149 -
 150
150 -
151
-
152
-
153
-
154
-
155
-
156
-
157
-
158
-
159
-
160
-
161
-
162
-
163
-
164
-
165
-
166
-
167
-
168
-
169
-
170
-
171
-
172
-
173
-
174
-
175
-
176
-
177
-
178
-
179
-
180
-
181
-
182
-
183
-
184
-
185
-
186
-
187
-
188
-
189
-
190
-
191
-
192
-
193
-
194
-
195
-
196
-
197
-
198
-
199
-
200
-
201
-
202
-
203
-
204
-
205
-
206
-
207
-
208
-
209
-
210
-
211
-
212
-
213
-
214
-
215
-
216
-
217
-
218
-
219
-
220
-
221
-
222
-
223
-
224
-
225
-
226
-
227
-
228
-
229
-
230
-
231
-
232
-
233
-
234
-
235
-
236
-
237
-
238
-
239
-
240
-
241
-
242
-
243
-
244
-
245
-
246
-
247
-
248
 |
 |

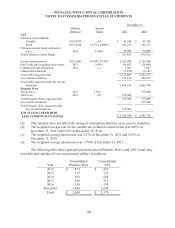
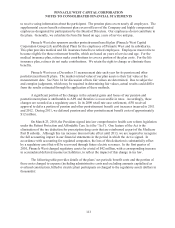
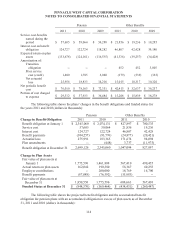
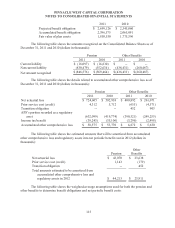
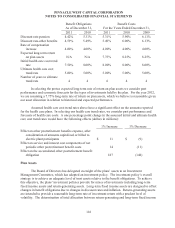
PINNACLE WEST CAPITAL CORPORATION
NOTES TO CONSOLIDATED FINANCIAL STATEMENTS
115
2011 2010
Projected benefit obligation $ 2,699,126 $ 2,345,060
Accumulated benefit obligation 2,396,575 2,065,091
Fair value of plan assets 1,850,550 1,775,596
The following table shows the amounts recognized on the Consolidated Balance Sheets as of
December 31, 2011 and 2010 (dollars in thousands):
Pension Other Benefits
2011 2010 2011 2010
Current liability $ (18,097) $ (16,830) $ -- $ --
Noncurrent liability (830,479) (552,634) (438,431) (260,487)
Net amount recognized $ (848,576) $ (569,464) $ (438,431) $ (260,487)
The following table shows the details related to accumulated other comprehensive loss as of
December 31, 2011 and 2010 (dollars in thousands):
Pension Other Benefits
2011 2010 2011 2010
Net actuarial loss $ 724,605 $ 502,938 $ 400,892 $ 261,071
Prior service cost (credit) 4,312 5,712 (655) (4,571)
Transition obligation -- -- 452 903
APS’s portion recorded as a regulatory
asset
(632,099)
(419,774)
(390,521)
(249,255)
Income tax benefit (38,243)
(35,106) (3,296) (2,498)
Accumulated other comprehensive loss $ 58,575 $ 53,770 $ 6,872 $ 5,650
The following table shows the estimated amounts that will be amortized from accumulated
other comprehensive loss and regulatory assets into net periodic benefit cost in 2012 (dollars in
thousands):
Pension
Other
Benefits
Net actuarial loss $ 43,070 $ 23,638
Prior service cost (credit) 1,143 (179)
Transition obligation --
452
Total amounts estimated to be amortized from
accumulated other comprehensive loss and
regulatory assets in 2012 $ 44,213
$ 23,911
The following table shows the weighted-average assumptions used for both the pension and
other benefits to determine benefit obligations and net periodic benefit costs: