APS 2011 Annual Report Download - page 105
Download and view the complete annual report
Please find page 105 of the 2011 APS annual report below. You can navigate through the pages in the report by either clicking on the pages listed below, or by using the keyword search tool below to find specific information within the annual report.-
 1
1 -
2
-
3
-
4
-
5
-
6
-
7
-
8
-
9
-
10
-
11
-
12
-
13
-
14
-
15
-
16
-
17
-
18
-
19
-
20
-
21
-
22
-
23
-
24
-
25
-
26
-
27
-
28
-
29
-
30
-
31
-
32
-
33
-
34
-
35
-
36
-
37
-
38
-
39
-
40
-
41
-
42
-
43
-
44
-
45
-
46
-
47
-
48
-
49
-
50
-
51
-
52
-
53
-
54
-
55
-
56
-
57
-
58
-
59
-
60
-
61
-
62
-
63
-
64
-
65
-
66
-
67
-
68
-
69
-
70
-
71
-
72
-
73
-
74
-
75
-
76
-
77
-
78
-
79
-
80
-
81
-
82
-
83
-
84
-
85
-
86
-
87
-
88
-
89
-
90
-
91
-
92
-
93
-
94
-
 95
95 -
 96
96 -
 97
97 -
 98
98 -
 99
99 -
 100
100 -
 101
101 -
 102
102 -
 103
103 -
 104
104 -
 105
105 -
 106
106 -
 107
107 -
 108
108 -
 109
109 -
 110
110 -
 111
111 -
 112
112 -
 113
113 -
 114
114 -
 115
115 -
116
-
117
-
118
-
119
-
120
-
121
-
122
-
123
-
124
-
125
-
126
-
127
-
128
-
129
-
130
-
131
-
132
-
133
-
134
-
135
-
136
-
137
-
138
-
139
-
140
-
141
-
142
-
143
-
144
-
145
-
146
-
147
-
148
-
149
-
150
-
151
-
152
-
153
-
154
-
155
-
156
-
157
-
158
-
159
-
160
-
161
-
162
-
163
-
164
-
165
-
166
-
167
-
168
-
169
-
170
-
171
-
172
-
173
-
174
-
175
-
176
-
177
-
178
-
179
-
180
-
181
-
182
-
183
-
184
-
185
-
186
-
187
-
188
-
189
-
190
-
191
-
192
-
193
-
194
-
195
-
196
-
197
-
198
-
199
-
200
-
201
-
202
-
203
-
204
-
205
-
206
-
207
-
208
-
209
-
210
-
211
-
212
-
213
-
214
-
215
-
216
-
217
-
218
-
219
-
220
-
221
-
222
-
223
-
224
-
225
-
226
-
227
-
228
-
229
-
230
-
231
-
232
-
233
-
234
-
235
-
236
-
237
-
238
-
239
-
240
-
241
-
242
-
243
-
244
-
245
-
246
-
247
-
248
 |
 |

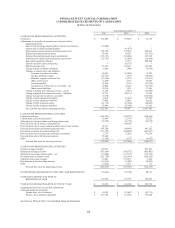
80
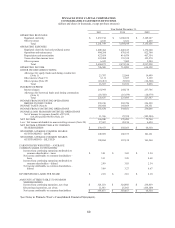
PINNACLE WEST CAPITAL CORPORATION
CONSOLIDATED STATEMENTS OF INCOME
(dollars and shares in thousands, except per share amounts)
Year Ended December 31,
2011 2010 2009
OPERATING REVENUES
Regulated electricity $ 3,237,194 $ 3,180,678 $ 3,149,187
Other revenues 4,185 8,521 4,469
Total 3,241,379 3,189,199 3,153,656
OPERATING EXPENSES
Regulated electricity fuel and purchased powe
r
1,009,464 1,046,815 1,178,620
Operations and maintenance 904,286 870,185 822,300
Depreciation and amortization 427,054 414,479 407,354
Taxes other than income taxes 147,408 135,328 123,270
Other expenses 6,659 7,509 5,984
Total 2,494,871 2,474,316 2,537,528
OPERATING INCOME 746,508 714,883 616,128
OTHER INCOME (DEDUCTIONS)
Allowance for equity funds used during construction
(Note 1) 23,707 22,066 14,999
Other income (Note 19) 3,111 6,387 5,159
Other expense (Note 19) (10,451) (9,921) (14,300)
Total 16,367 18,532 5,858
INTEREST EXPENSE
Interest charges 241,995 244,174 237,766
Allowance for borrowed funds used during construction
(Note 1) (18,358) (16,479) (10,379)
Total 223,637 227,695 227,387
INCOME FROM CONTINUING OPERATIONS
BEFORE INCOME TAXES 539,238 505,720 394,599
INCOME TAXES (Note 4) 183,604 160,869 138,551
INCOME FROM CONTINUING OPERATIONS 355,634 344,851 256,048
INCOME (LOSS) FROM DISCONTINUED OPERATIONS
Net of income tax expense (benefit) of $7,418,
$16,260 and $(109,641) (Note 21) 11,306 25,358 (183,284)
NET INCOME 366,940 370,209 72,764
Less: Net income attributable to noncontrolling interests (Note 20) 27,467 20,156 4,434
NET INCOME ATTRIBUTABLE TO COMMON
SHAREHOLDERS $ 339,473 $ 350,053
$ 68,330
WEIGHTED-AVERAGE COMMON SHARES
OUTSTANDING – BASIC
109,053 106,573 101,161
WEIGHTED-AVERAGE COMMON SHARES
OUTSTANDING – DILUTED
109,864 107,138 101,264
EARNINGS PER WEIGHTED
–
AVERAGE
COMMON SHARE OUTSTANDING
Income from continuing operations attributable to
common shareholders
–
b
asic $ 3.01 $ 3.05 $ 2.34
Net income attributable to common shareholders
–
b
asic 3.11 3.28 0.68
Income from continuing operations attributable to
common shareholders
–
dilute
d
2.99 3.03 2.34
Net income attributable to common shareholders
–
dilute
d
3.09 3.27 0.67
DIVIDENDS DECLARED PER SHARE $ 2.10 $ 2.10 $ 2.10
AMOUNTS ATTRIBUTABLE TO COMMON
SHAREHOLDERS:
Income from continuing operations, net of tax $ 328,110 $ 324,688 $ 236,839
Discontinued operations, net of tax 11,363 25,365 (168,509)
Net income attributable to common shareholders $ 339,473 $ 350,053 $ 68,330
See Notes to Pinnacle West’s Consolidated Financial Statements.