APS 2011 Annual Report Download - page 184
Download and view the complete annual report
Please find page 184 of the 2011 APS annual report below. You can navigate through the pages in the report by either clicking on the pages listed below, or by using the keyword search tool below to find specific information within the annual report.-
 1
1 -
2
-
3
-
4
-
5
-
6
-
7
-
8
-
9
-
10
-
11
-
12
-
13
-
14
-
15
-
16
-
17
-
18
-
19
-
20
-
21
-
22
-
23
-
24
-
25
-
26
-
27
-
28
-
29
-
30
-
31
-
32
-
33
-
34
-
35
-
36
-
37
-
38
-
39
-
40
-
41
-
42
-
43
-
44
-
45
-
46
-
47
-
48
-
49
-
50
-
51
-
52
-
53
-
54
-
55
-
56
-
57
-
58
-
59
-
60
-
61
-
62
-
63
-
64
-
65
-
66
-
67
-
68
-
69
-
70
-
71
-
72
-
73
-
74
-
75
-
76
-
77
-
78
-
79
-
80
-
81
-
82
-
83
-
84
-
85
-
86
-
87
-
88
-
89
-
90
-
91
-
92
-
93
-
94
-
95
-
96
-
97
-
98
-
99
-
100
-
101
-
102
-
103
-
104
-
105
-
106
-
107
-
108
-
109
-
110
-
111
-
112
-
113
-
114
-
115
-
116
-
117
-
118
-
119
-
120
-
121
-
122
-
123
-
124
-
125
-
126
-
127
-
128
-
129
-
130
-
131
-
132
-
133
-
134
-
135
-
136
-
137
-
138
-
139
-
140
-
141
-
142
-
143
-
144
-
145
-
146
-
147
-
148
-
149
-
150
-
151
-
152
-
153
-
154
-
155
-
156
-
157
-
158
-
159
-
160
-
161
-
162
-
163
-
164
-
165
-
166
-
167
-
168
-
169
-
170
-
171
-
172
-
173
-
 174
174 -
 175
175 -
 176
176 -
 177
177 -
 178
178 -
 179
179 -
 180
180 -
 181
181 -
 182
182 -
 183
183 -
 184
184 -
 185
185 -
 186
186 -
 187
187 -
 188
188 -
 189
189 -
 190
190 -
 191
191 -
 192
192 -
 193
193 -
 194
194 -
195
-
196
-
197
-
198
-
199
-
200
-
201
-
202
-
203
-
204
-
205
-
206
-
207
-
208
-
209
-
210
-
211
-
212
-
213
-
214
-
215
-
216
-
217
-
218
-
219
-
220
-
221
-
222
-
223
-
224
-
225
-
226
-
227
-
228
-
229
-
230
-
231
-
232
-
233
-
234
-
235
-
236
-
237
-
238
-
239
-
240
-
241
-
242
-
243
-
244
-
245
-
246
-
247
-
248
 |
 |

159
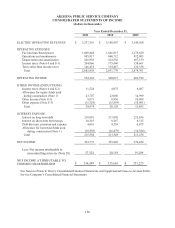
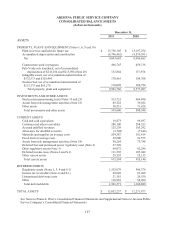
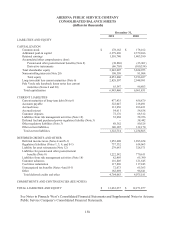
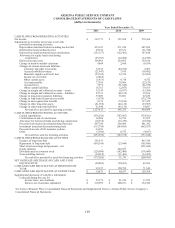
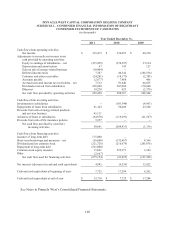
ARIZONA PUBLIC SERVICE COMPANY
CONSOLIDATED STATEMENTS OF CASH FLOWS
(dollars in thousands)
Year Ended December 31,
2011 2010 2009
CASH FLOWS FROM OPERATING ACTIVITIES
Net income $ 363,773 $ 355,826 $ 270,434
Adjustments to reconcile net income to net cash
p
rovided by operating activities:
Depreciation and amortization including nuclear fuel 493,653 471,226 445,988
Deferred fuel and purchased powe
r
69,166 93,631 (51,742)
Deferred fuel and purchased powe
r
amortization (155,157) (122,481) 147,018
Allowance for equity funds used during
construction (23,707) (22,066) (14,999)
Deferred income taxes 168,805 224,095 192,914
Change in mar
k
-to-market valuations 4,064 2,688 (6,939)
Changes in current assets and liabilities:
Customer and other receivables 34,913 (49,956) 2,603
Accrued unbilled revenues (21,947) 7,679 (10,882)
Materials, supplies and fossil fuel (23,398) 12,276 (12,261)
Income tax receivable (2,869) -- --
Other current assets (5,473) 4,718 4,332
Accounts payable 73,369 18,066 (22,129)
Accrued taxes 7,972 (51,620) (61,078)
Other current liabilities 18,762 (2,853) 54,913
Change in margin an
d
collateral accounts
–
assets 33,349 (9,937) (13,206)
Change in margin and collateral accounts
–
liabilities 29,731 (88,315) 35,654
Change in long-term regulatory liabilities 37,009 56,801 82,650
Change in long-term income tax receivable (3,530) -- (132,379)
Change in unrecognized tax benefits 9,125 (73,189) 137,478
Change in other long-term assets (41,788) (46,118) (67,507)
Change in other long-term liabilities 61,990 (85,136) 14,097
Net cash flow provided by operating activities 1,127,812 695,335 994,959
CASH FLOWS FROM INVESTING ACTIVITIES
Capital expenditures (878,546) (747,967) (754,301)
Contributions in aid of construction 38,096 32,754 53,525
Allowance for
b
orrowed funds used during construction (18,358) (16,479) (10,386)
Proceeds from nuclear decommissioning trust sales 497,780 560,469 441,242
Investment in nuclear decommissioning trust (513,799) (584,885) (463,033)
Proceeds from sale of life insurance policies 44,183 -- --
Othe
r
(3,306) 8,576 (4,667)
Net cash flow used for investing activities (833,950) (747,532) (737,620)
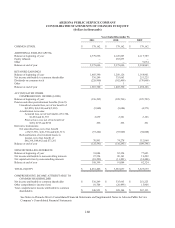
CASH FLOWS FROM FINANCING ACTIVITIES
Issuance of long-term debt 295,353 -- 863,780
Repayment of long-term debt (430,169) (27,694) (365,696)
Short-term borrowings and payments
–
net -- -- (521,684)
Equity infusion -- 252,833 --
Dividends paid on common stoc
k
(228,900) (182,400) (170,000)
Noncontrolling interests (10,210) (11,403) (14,485)
Net cash flow provided by (used for) financing activities (373,926) 31,336 (208,085)
NET INCREASE (DECREASE) IN CASH AND CASH
EQUIVALENTS (80,064) (20,861) 49,254
CASH AND CASH EQUIVALENTS AT BEGINNING OF
YEAR 99,937 120,798 71,544
CASH AND CASH EQUIVALENTS AT END OF YEAR $ 19,873 $ 99,937 $ 120,798
Supplemental disclosure of cash flow information:
Cash paid during the year for:
Income taxes, net of refunds $ 25,975 $ 81,339 $ 13,555
Interest, net of amounts capitalize
d
$ 210,995 $ 208,251 $ 194,346
See Notes to Pinnacle West’s Consolidated Financial Statements and Supplemental Notes to Arizona Public Service Company’s
Consolidated Financial Statements.