APS 2011 Annual Report Download - page 194
Download and view the complete annual report
Please find page 194 of the 2011 APS annual report below. You can navigate through the pages in the report by either clicking on the pages listed below, or by using the keyword search tool below to find specific information within the annual report.-
 1
1 -
2
-
3
-
4
-
5
-
6
-
7
-
8
-
9
-
10
-
11
-
12
-
13
-
14
-
15
-
16
-
17
-
18
-
19
-
20
-
21
-
22
-
23
-
24
-
25
-
26
-
27
-
28
-
29
-
30
-
31
-
32
-
33
-
34
-
35
-
36
-
37
-
38
-
39
-
40
-
41
-
42
-
43
-
44
-
45
-
46
-
47
-
48
-
49
-
50
-
51
-
52
-
53
-
54
-
55
-
56
-
57
-
58
-
59
-
60
-
61
-
62
-
63
-
64
-
65
-
66
-
67
-
68
-
69
-
70
-
71
-
72
-
73
-
74
-
75
-
76
-
77
-
78
-
79
-
80
-
81
-
82
-
83
-
84
-
85
-
86
-
87
-
88
-
89
-
90
-
91
-
92
-
93
-
94
-
95
-
96
-
97
-
98
-
99
-
100
-
101
-
102
-
103
-
104
-
105
-
106
-
107
-
108
-
109
-
110
-
111
-
112
-
113
-
114
-
115
-
116
-
117
-
118
-
119
-
120
-
121
-
122
-
123
-
124
-
125
-
126
-
127
-
128
-
129
-
130
-
131
-
132
-
133
-
134
-
135
-
136
-
137
-
138
-
139
-
140
-
141
-
142
-
143
-
144
-
145
-
146
-
147
-
148
-
149
-
150
-
151
-
152
-
153
-
154
-
155
-
156
-
157
-
158
-
159
-
160
-
161
-
162
-
163
-
164
-
165
-
166
-
167
-
168
-
169
-
170
-
171
-
172
-
173
-
174
-
175
-
176
-
177
-
178
-
179
-
180
-
181
-
182
-
183
-
 184
184 -
 185
185 -
 186
186 -
 187
187 -
 188
188 -
 189
189 -
 190
190 -
 191
191 -
 192
192 -
 193
193 -
 194
194 -
 195
195 -
 196
196 -
 197
197 -
 198
198 -
 199
199 -
 200
200 -
 201
201 -
 202
202 -
 203
203 -
 204
204 -
205
-
206
-
207
-
208
-
209
-
210
-
211
-
212
-
213
-
214
-
215
-
216
-
217
-
218
-
219
-
220
-
221
-
222
-
223
-
224
-
225
-
226
-
227
-
228
-
229
-
230
-
231
-
232
-
233
-
234
-
235
-
236
-
237
-
238
-
239
-
240
-
241
-
242
-
243
-
244
-
245
-
246
-
247
-
248
 |
 |

169
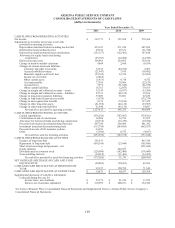
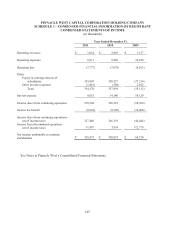
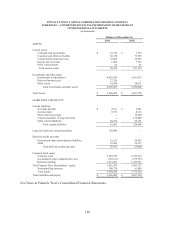
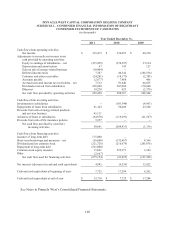
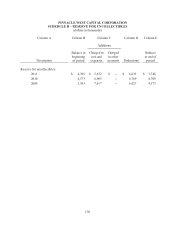
PINNACLE WEST CAPITAL CORPORATION HOLDING COMPANY
SCHEDULE I – CONDENSED FINANCIAL INFORMATION OF REGISTRANT
CONDENSED STATEMENTS OF CASH FLOWS
(in thousands)
Year Ended December 31,
2011 2010 2009
Cash flows from operating activities
Net income $ 339,473 $ 350,053 $ 68,330
Adjustments to reconcile net income to net
cash provided by operating activities:
Equity in earnings of subsidiaries – net (335,859) (358,527) 37,214
Depreciation and amortization 97 143 127
Gain on sale of energy-related business (10,404) -- --
Deferred income taxes 7,387 40,342 (106,536)
Customer and other receivables (24,201) (18,175) (2,303)
Accounts payable (2,677) 7,468 466
Accrued taxes and income tax receivables – net 7,512 59,640 44,625
Dividends received from subsidiaries 228,900 207,000 170,000
Other net 19,270 423 (2,379)
Net cash flow provided by operating activities 229,498 288,367 209,544
Cash flows from investing activities
Investments in subsidiaries -- (183,544) (4,967)
Repayments of loans from subsidiaries 61,143 98,406 25,240
Proceeds from sale of energy-related products
and services business 45,111 -- --
Advances of loans to subsidiaries (64,970) (119,293) (21,587)
Proceeds from sale of life insurance policies 9,357 -- --
Net cash flow provided by (used for)
investing activities 50,641 (204,431) (1,314)
Cash flows from financing activities
Issuance of long-term debt 175,000 -- --
Short-term borrowings and payments – net (16,600) (132,487) 4,566
Dividends paid on common stock (221,728) (216,979) (205,076)
Repayment of long-term debt (225,000) -- --
Common stock equity issuance 15,841 255,971 3,302
Other (2,667) -- --
Net cash flow used for financing activities (275,154) (93,495) (197,208)
Net increase (decrease) in cash and cash equivalents 4,985 (9,559) 11,022
Cash and cash equivalents at beginning of year 7,725 17,284 6,262
Cash and cash equivalents at end of year $ 12,710 $ 7,725 $ 17,284
See Notes to Pinnacle West’s Consolidated Financial Statements.