APS 2011 Annual Report Download - page 82
Download and view the complete annual report
Please find page 82 of the 2011 APS annual report below. You can navigate through the pages in the report by either clicking on the pages listed below, or by using the keyword search tool below to find specific information within the annual report.-
 1
1 -
2
-
3
-
4
-
5
-
6
-
7
-
8
-
9
-
10
-
11
-
12
-
13
-
14
-
15
-
16
-
17
-
18
-
19
-
20
-
21
-
22
-
23
-
24
-
25
-
26
-
27
-
28
-
29
-
30
-
31
-
32
-
33
-
34
-
35
-
36
-
37
-
38
-
39
-
40
-
41
-
42
-
43
-
44
-
45
-
46
-
47
-
48
-
49
-
50
-
51
-
52
-
53
-
54
-
55
-
56
-
57
-
58
-
59
-
60
-
61
-
62
-
63
-
64
-
65
-
66
-
67
-
68
-
69
-
70
-
71
-
 72
72 -
 73
73 -
 74
74 -
 75
75 -
 76
76 -
 77
77 -
 78
78 -
 79
79 -
 80
80 -
 81
81 -
 82
82 -
 83
83 -
 84
84 -
 85
85 -
 86
86 -
 87
87 -
 88
88 -
 89
89 -
 90
90 -
 91
91 -
 92
92 -
93
-
94
-
95
-
96
-
97
-
98
-
99
-
100
-
101
-
102
-
103
-
104
-
105
-
106
-
107
-
108
-
109
-
110
-
111
-
112
-
113
-
114
-
115
-
116
-
117
-
118
-
119
-
120
-
121
-
122
-
123
-
124
-
125
-
126
-
127
-
128
-
129
-
130
-
131
-
132
-
133
-
134
-
135
-
136
-
137
-
138
-
139
-
140
-
141
-
142
-
143
-
144
-
145
-
146
-
147
-
148
-
149
-
150
-
151
-
152
-
153
-
154
-
155
-
156
-
157
-
158
-
159
-
160
-
161
-
162
-
163
-
164
-
165
-
166
-
167
-
168
-
169
-
170
-
171
-
172
-
173
-
174
-
175
-
176
-
177
-
178
-
179
-
180
-
181
-
182
-
183
-
184
-
185
-
186
-
187
-
188
-
189
-
190
-
191
-
192
-
193
-
194
-
195
-
196
-
197
-
198
-
199
-
200
-
201
-
202
-
203
-
204
-
205
-
206
-
207
-
208
-
209
-
210
-
211
-
212
-
213
-
214
-
215
-
216
-
217
-
218
-
219
-
220
-
221
-
222
-
223
-
224
-
225
-
226
-
227
-
228
-
229
-
230
-
231
-
232
-
233
-
234
-
235
-
236
-
237
-
238
-
239
-
240
-
241
-
242
-
243
-
244
-
245
-
246
-
247
-
248
 |
 |

58
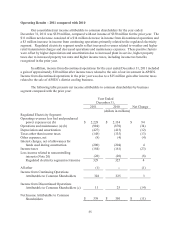
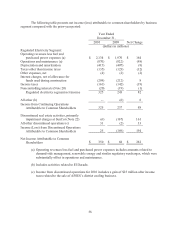
The following table presents net income (loss) attributable to common shareholders by business
segment compared with the prior-year period:
Year Ended
December 31,
Net Change
2010 2009
(dollars in millions)
Regulated Electricity Segment:
Operating revenues less fuel and
purchased power expenses (a) $ 2,134 $ 1,970 $ 164
Operations and maintenance (a) (870) (822) (48)
Depreciation and amortization (415) (407) (8)
Taxes other than income taxes (135) (123) (12)
Other expenses, net (4) (2) (2)
Interest charges, net of allowance for
funds used during construction (204) (212) 8
Income taxes (161) (142) (19)
Noncontrolling interests (Note 20) (20) (19) (1)
Regulated electricity segment net income 325 243 82
All other (b) -- (6) 6
Income from Continuing Operations
Attributable to Common Shareholders 325 237 88
Discontinued real estate activities, primarily
impairment charges at SunCor (Note 22) (6) (167) 161
All other discontinued operations (c) 31 (2) 33
Income (Loss) from Discontinued Operations
Attributable to Common Shareholders 25 (169) 194
Net Income Attributable to Common
Shareholders $ 350 $ 68 $ 282
(a) Operating revenues less fuel and purchased power expenses includes amounts related to
demand-side management, renewable energy and similar regulatory surcharges, which were
substantially offset in operations and maintenance.
(b) Includes activities related to El Dorado.
(c) Income from discontinued operations for 2010 includes a gain of $25 million after income
taxes related to the sale of APSES’s district cooling business.