APS 2011 Annual Report Download - page 71
Download and view the complete annual report
Please find page 71 of the 2011 APS annual report below. You can navigate through the pages in the report by either clicking on the pages listed below, or by using the keyword search tool below to find specific information within the annual report.-
 1
1 -
2
-
3
-
4
-
5
-
6
-
7
-
8
-
9
-
10
-
11
-
12
-
13
-
14
-
15
-
16
-
17
-
18
-
19
-
20
-
21
-
22
-
23
-
24
-
25
-
26
-
27
-
28
-
29
-
30
-
31
-
32
-
33
-
34
-
35
-
36
-
37
-
38
-
39
-
40
-
41
-
42
-
43
-
44
-
45
-
46
-
47
-
48
-
49
-
50
-
51
-
52
-
53
-
54
-
55
-
56
-
57
-
58
-
59
-
60
-
 61
61 -
 62
62 -
 63
63 -
 64
64 -
 65
65 -
 66
66 -
 67
67 -
 68
68 -
 69
69 -
 70
70 -
 71
71 -
 72
72 -
 73
73 -
 74
74 -
 75
75 -
 76
76 -
 77
77 -
 78
78 -
 79
79 -
 80
80 -
 81
81 -
82
-
83
-
84
-
85
-
86
-
87
-
88
-
89
-
90
-
91
-
92
-
93
-
94
-
95
-
96
-
97
-
98
-
99
-
100
-
101
-
102
-
103
-
104
-
105
-
106
-
107
-
108
-
109
-
110
-
111
-
112
-
113
-
114
-
115
-
116
-
117
-
118
-
119
-
120
-
121
-
122
-
123
-
124
-
125
-
126
-
127
-
128
-
129
-
130
-
131
-
132
-
133
-
134
-
135
-
136
-
137
-
138
-
139
-
140
-
141
-
142
-
143
-
144
-
145
-
146
-
147
-
148
-
149
-
150
-
151
-
152
-
153
-
154
-
155
-
156
-
157
-
158
-
159
-
160
-
161
-
162
-
163
-
164
-
165
-
166
-
167
-
168
-
169
-
170
-
171
-
172
-
173
-
174
-
175
-
176
-
177
-
178
-
179
-
180
-
181
-
182
-
183
-
184
-
185
-
186
-
187
-
188
-
189
-
190
-
191
-
192
-
193
-
194
-
195
-
196
-
197
-
198
-
199
-
200
-
201
-
202
-
203
-
204
-
205
-
206
-
207
-
208
-
209
-
210
-
211
-
212
-
213
-
214
-
215
-
216
-
217
-
218
-
219
-
220
-
221
-
222
-
223
-
224
-
225
-
226
-
227
-
228
-
229
-
230
-
231
-
232
-
233
-
234
-
235
-
236
-
237
-
238
-
239
-
240
-
241
-
242
-
243
-
244
-
245
-
246
-
247
-
248
 |
 |

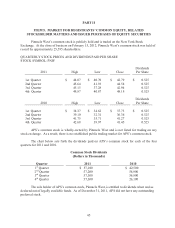
47
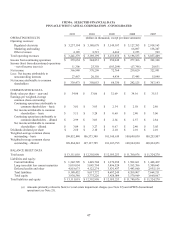
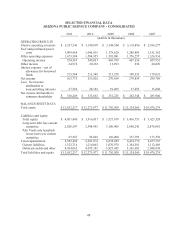
ITEM 6. SELECTED FINANCIAL DATA
PINNACLE WEST CAPITAL CORPORATION - CONSOLIDATED
2011 2010 2009 2008 2007
OPERATING RESULTS (dollars in thousands, except per share amounts)
Operating revenues:
Regulated electricity $ 3,237,194 $ 3,180,678 $ 3,149,187 $ 3,127,383 $ 2,918,163
Marketing and trading -- -- -- 66,897 138,247
Other revenues 4,185 8,521 4,469 2,253 999
Total operating revenues $ 3,241,379 $ 3,189,199 $ 3,153,656 $ 3,196,533 $ 3,057,409
Income from continuing operations $ 355,634 $ 344,851 $ 256,048 $ 277,366 $ 302,360
Income (loss) from discontinued operations
– net of income taxes (a)
11,306
25,358
(183,284)
(17,746)
20,631
Net income 366,940 370,209 72,764 259,620 322,991
Less: Net income attributable to
noncontrolling interests 27,467 20,156 4,434 17,495 15,848
Net income attributable to common
shareholders $ 339,473
$ 350,053 $ 68,330 $ 242,125 $ 307,143
COMMON STOCK DATA
Book value per share – year-end $ 34.98 $ 33.86 $ 32.69 $ 34.16 $ 35.15
Earnings per weighted-average
common share outstanding:
Continuing operations attributable to
common shareholders – basic $ 3.01 $ 3.05 $ 2.34 $ 2.58 $ 2.86
Net income attributable to common
shareholders – basic
$ 3.11
$ 3.28
$ 0.68
$ 2.40
$ 3.06
Continuing operations attributable to
common shareholders – diluted $ 2.99 $ 3.03 $ 2.34 $ 2.57 $ 2.84
Net income attributable to common
shareholders – diluted $ 3.09 $ 3.27 $ 0.67 $ 2.40 $ 3.05
Dividends declared per share $ 2.10 $ 2.10 $ 2.10 $ 2.10 $ 2.10
Weighted-average common shares
outstanding – basic 109,052,840 106,573,348 101,160,659
100,690,838
100,255,807
Weighted-average common shares
outstanding – diluted 109,864,243 107,137,785 101,263,795
100,964,920
100,834,871
BALANCE SHEET DATA
Total assets $ 13,111,018 $ 12,392,9 98 $ 1 2,035,253 $ 11,780,876 $ 11,324,2 78
Liabilities and equity:
Current liabilities $ 1,342,705 $ 1,449,704 $ 1,279,288 $ 1,582,661 $ 1,408,429
Long-term debt less current maturities 3,019,054 3,045,794 3,496,524 3,183,386 3,300,663
Deferred credits and other 4,818,673 4,122,274 3,831,437 3,443,860 2,955,119
Total liabilities 9,180,432 8,617,772 8,607,249 8,209,907 7,664,211
Total equity 3,930,586 3,775,226 3,428,004 3,570,969 3,660,067
Total liabilities and equity $ 13,111,018 $ 12,392,998 $ 12,035,253 $ 11,780,876 $ 11,324,278
(a) Amounts primarily related to SunCor’s real estate impairment charges (see Note 22) and APSES discontinued
operations (see Note 21).