APS 2011 Annual Report Download - page 128
Download and view the complete annual report
Please find page 128 of the 2011 APS annual report below. You can navigate through the pages in the report by either clicking on the pages listed below, or by using the keyword search tool below to find specific information within the annual report.-
 1
1 -
2
-
3
-
4
-
5
-
6
-
7
-
8
-
9
-
10
-
11
-
12
-
13
-
14
-
15
-
16
-
17
-
18
-
19
-
20
-
21
-
22
-
23
-
24
-
25
-
26
-
27
-
28
-
29
-
30
-
31
-
32
-
33
-
34
-
35
-
36
-
37
-
38
-
39
-
40
-
41
-
42
-
43
-
44
-
45
-
46
-
47
-
48
-
49
-
50
-
51
-
52
-
53
-
54
-
55
-
56
-
57
-
58
-
59
-
60
-
61
-
62
-
63
-
64
-
65
-
66
-
67
-
68
-
69
-
70
-
71
-
72
-
73
-
74
-
75
-
76
-
77
-
78
-
79
-
80
-
81
-
82
-
83
-
84
-
85
-
86
-
87
-
88
-
89
-
90
-
91
-
92
-
93
-
94
-
95
-
96
-
97
-
98
-
99
-
100
-
101
-
102
-
103
-
104
-
105
-
106
-
107
-
108
-
109
-
110
-
111
-
112
-
113
-
114
-
115
-
116
-
117
-
 118
118 -
 119
119 -
 120
120 -
 121
121 -
 122
122 -
 123
123 -
 124
124 -
 125
125 -
 126
126 -
 127
127 -
 128
128 -
 129
129 -
 130
130 -
 131
131 -
 132
132 -
 133
133 -
 134
134 -
 135
135 -
 136
136 -
 137
137 -
 138
138 -
139
-
140
-
141
-
142
-
143
-
144
-
145
-
146
-
147
-
148
-
149
-
150
-
151
-
152
-
153
-
154
-
155
-
156
-
157
-
158
-
159
-
160
-
161
-
162
-
163
-
164
-
165
-
166
-
167
-
168
-
169
-
170
-
171
-
172
-
173
-
174
-
175
-
176
-
177
-
178
-
179
-
180
-
181
-
182
-
183
-
184
-
185
-
186
-
187
-
188
-
189
-
190
-
191
-
192
-
193
-
194
-
195
-
196
-
197
-
198
-
199
-
200
-
201
-
202
-
203
-
204
-
205
-
206
-
207
-
208
-
209
-
210
-
211
-
212
-
213
-
214
-
215
-
216
-
217
-
218
-
219
-
220
-
221
-
222
-
223
-
224
-
225
-
226
-
227
-
228
-
229
-
230
-
231
-
232
-
233
-
234
-
235
-
236
-
237
-
238
-
239
-
240
-
241
-
242
-
243
-
244
-
245
-
246
-
247
-
248
 |
 |

PINNACLE WEST CAPITAL CORPORATION
NOTES TO CONSOLIDATED FINANCIAL STATEMENTS
103
Year Ended December 31,
2011 2010 2009
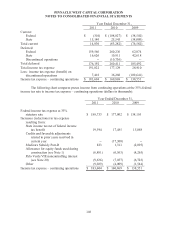
Current:
Federal $ (310) $ (108,827) $ (38,502)
State 15,140 25,545 (38,080)
Total current 14,830 (83,282) (76,582)
Deferred:
Federal 159,566 260,236 62,874
State 16,626 10,911 42,618
Discontinued operations -- (10,736) --
Total deferred 176,192 260,411 105,492
Total income tax expense 191,022 177,129 28,910
Less: income tax expense (benefit) on
discontinued operations 7,418 16,260 (109,641)
Income tax expense – continuing operations $ 183,604 $ 160,869 $ 138,551
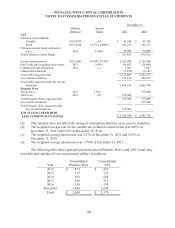
The following chart compares pretax income from continuing operations at the 35% federal
income tax rate to income tax expense – continuing operations (dollars in thousands):
Year Ended December 31,
2011 2010 2009
Federal income tax expense at 35%
statutory rate
$ 188,733
$ 177,002
$ 138,110
Increases (reductions) in tax expense
resulting from:
State income tax net of federal income
tax benefit
19,594
17,485
15,068
Credits and favorable adjustments
related to prior years resolved in
current year
--
(17,300)
--
Medicare Subsidy Part-D 823 1,311 (2,095)
Allowance for equity funds used during
construction (see Note 1)
(6,881)
(6,563)
(4,265)
Palo Verde VIE noncontrolling interest
(see Note 20)
(9,636)
(7,057)
(6,723)
Other (9,029) (4,009) (1,544)
Income tax expense – continuing operations $ 183,604 $ 160,869 $ 138,551