APS 2011 Annual Report Download - page 85
Download and view the complete annual report
Please find page 85 of the 2011 APS annual report below. You can navigate through the pages in the report by either clicking on the pages listed below, or by using the keyword search tool below to find specific information within the annual report.-
 1
1 -
2
-
3
-
4
-
5
-
6
-
7
-
8
-
9
-
10
-
11
-
12
-
13
-
14
-
15
-
16
-
17
-
18
-
19
-
20
-
21
-
22
-
23
-
24
-
25
-
26
-
27
-
28
-
29
-
30
-
31
-
32
-
33
-
34
-
35
-
36
-
37
-
38
-
39
-
40
-
41
-
42
-
43
-
44
-
45
-
46
-
47
-
48
-
49
-
50
-
51
-
52
-
53
-
54
-
55
-
56
-
57
-
58
-
59
-
60
-
61
-
62
-
63
-
64
-
65
-
66
-
67
-
68
-
69
-
70
-
71
-
72
-
73
-
74
-
 75
75 -
 76
76 -
 77
77 -
 78
78 -
 79
79 -
 80
80 -
 81
81 -
 82
82 -
 83
83 -
 84
84 -
 85
85 -
 86
86 -
 87
87 -
 88
88 -
 89
89 -
 90
90 -
 91
91 -
 92
92 -
 93
93 -
 94
94 -
 95
95 -
96
-
97
-
98
-
99
-
100
-
101
-
102
-
103
-
104
-
105
-
106
-
107
-
108
-
109
-
110
-
111
-
112
-
113
-
114
-
115
-
116
-
117
-
118
-
119
-
120
-
121
-
122
-
123
-
124
-
125
-
126
-
127
-
128
-
129
-
130
-
131
-
132
-
133
-
134
-
135
-
136
-
137
-
138
-
139
-
140
-
141
-
142
-
143
-
144
-
145
-
146
-
147
-
148
-
149
-
150
-
151
-
152
-
153
-
154
-
155
-
156
-
157
-
158
-
159
-
160
-
161
-
162
-
163
-
164
-
165
-
166
-
167
-
168
-
169
-
170
-
171
-
172
-
173
-
174
-
175
-
176
-
177
-
178
-
179
-
180
-
181
-
182
-
183
-
184
-
185
-
186
-
187
-
188
-
189
-
190
-
191
-
192
-
193
-
194
-
195
-
196
-
197
-
198
-
199
-
200
-
201
-
202
-
203
-
204
-
205
-
206
-
207
-
208
-
209
-
210
-
211
-
212
-
213
-
214
-
215
-
216
-
217
-
218
-
219
-
220
-
221
-
222
-
223
-
224
-
225
-
226
-
227
-
228
-
229
-
230
-
231
-
232
-
233
-
234
-
235
-
236
-
237
-
238
-
239
-
240
-
241
-
242
-
243
-
244
-
245
-
246
-
247
-
248
 |
 |

61
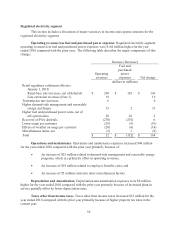
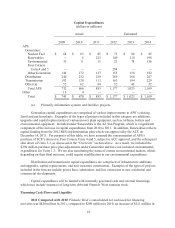
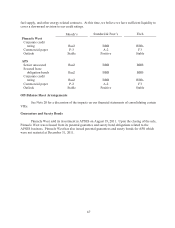
APS’s capital requirements consist primarily of capital expenditures and maturities of long-
term debt. APS funds its capital requirements with cash from operations and, to the extent necessary,
external debt financing and equity infusions from Pinnacle West.
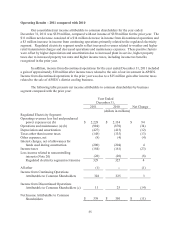
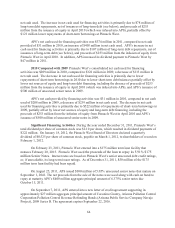
Many of APS’s current capital expenditure projects qualify for bonus depreciation. The Tax
Relief, Unemployment Insurance Reauthorization and Job Creation Act of 2010 includes provisions
making qualified property placed into service after September 8, 2010 and before January 1, 2012
eligible for 100% bonus depreciation for federal income tax purposes. In addition, qualified property
placed into service in 2012 is eligible for 50% bonus depreciation for federal income tax purposes.
These provisions of the recent tax legislation are expected to generate approximately $425-475 million
of cash tax benefits for APS through accelerated depreciation. It is anticipated that these cash benefits
will be fully realized by APS by the end of 2013, with a majority of the benefit realized in 2012. The
cash generated is an acceleration of tax benefits that APS would have otherwise received over 20
years.
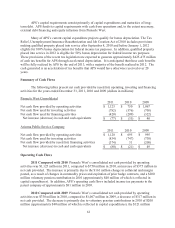
Summary of Cash Flows
The following tables present net cash provided by (used for) operating, investing and financing
activities for the years ended December 31, 2011, 2010 and 2009 (dollars in millions):
Pinnacle West Consolidated
2011 2010 2009
Net cash flow provided by operating activities $ 1,125 $ 750 $ 1,067
Net cash flow used for investing activities (782) (576) (705)
Net cash flow used for financing activities (420) (209) (322)
Net increase (decrease) in cash and cash equivalents $ (77) $ (35) $ 40
Arizona Public Service Company
2011 2010 2009
Net cash flow provided by operating activities $ 1,128 $ 695 $ 995
Net cash flow used for investing activities (834) (747) (738)
Net cash flow provided by (used for) financing activities (374) 31 (208)
Net increase (decrease) in cash and cash equivalents $ (80) $ (21) $ 49
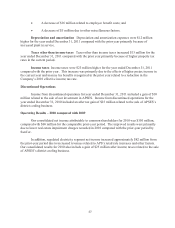
Operating Cash Flows
2011 Compared with 2010 Pinnacle West’s consolidated net cash provided by operating
activities was $1,125 million in 2011, compared to $750 million in 2010, an increase of $375 million in
net cash provided. The increase is primarily due to the $161 million change in collateral and margin
posted, as a result of changes in commodity prices and expiration of prior hedge contracts, and a $200
million voluntary pension contribution in 2010 (approximately $40 million of which is reflected in
capital expenditures). In addition, APS’s operating cash flows included income tax payments to the
parent company of approximately $81 million in 2010.
2010 Compared with 2009 Pinnacle West’s consolidated net cash provided by operating
activities was $750 million in 2010, compared to $1,067 million in 2009, a decrease of $317 million in
net cash provided. The decrease is primarily due to voluntary pension contributions in 2010 of $200
million (approximately $40 million of which is reflected in capital expenditures), the $121 million