APS 2011 Annual Report Download - page 163
Download and view the complete annual report
Please find page 163 of the 2011 APS annual report below. You can navigate through the pages in the report by either clicking on the pages listed below, or by using the keyword search tool below to find specific information within the annual report.-
 1
1 -
2
-
3
-
4
-
5
-
6
-
7
-
8
-
9
-
10
-
11
-
12
-
13
-
14
-
15
-
16
-
17
-
18
-
19
-
20
-
21
-
22
-
23
-
24
-
25
-
26
-
27
-
28
-
29
-
30
-
31
-
32
-
33
-
34
-
35
-
36
-
37
-
38
-
39
-
40
-
41
-
42
-
43
-
44
-
45
-
46
-
47
-
48
-
49
-
50
-
51
-
52
-
53
-
54
-
55
-
56
-
57
-
58
-
59
-
60
-
61
-
62
-
63
-
64
-
65
-
66
-
67
-
68
-
69
-
70
-
71
-
72
-
73
-
74
-
75
-
76
-
77
-
78
-
79
-
80
-
81
-
82
-
83
-
84
-
85
-
86
-
87
-
88
-
89
-
90
-
91
-
92
-
93
-
94
-
95
-
96
-
97
-
98
-
99
-
100
-
101
-
102
-
103
-
104
-
105
-
106
-
107
-
108
-
109
-
110
-
111
-
112
-
113
-
114
-
115
-
116
-
117
-
118
-
119
-
120
-
121
-
122
-
123
-
124
-
125
-
126
-
127
-
128
-
129
-
130
-
131
-
132
-
133
-
134
-
135
-
136
-
137
-
138
-
139
-
140
-
141
-
142
-
143
-
144
-
145
-
146
-
147
-
148
-
149
-
150
-
151
-
152
-
 153
153 -
 154
154 -
 155
155 -
 156
156 -
 157
157 -
 158
158 -
 159
159 -
 160
160 -
 161
161 -
 162
162 -
 163
163 -
 164
164 -
 165
165 -
 166
166 -
 167
167 -
 168
168 -
 169
169 -
 170
170 -
 171
171 -
 172
172 -
 173
173 -
174
-
175
-
176
-
177
-
178
-
179
-
180
-
181
-
182
-
183
-
184
-
185
-
186
-
187
-
188
-
189
-
190
-
191
-
192
-
193
-
194
-
195
-
196
-
197
-
198
-
199
-
200
-
201
-
202
-
203
-
204
-
205
-
206
-
207
-
208
-
209
-
210
-
211
-
212
-
213
-
214
-
215
-
216
-
217
-
218
-
219
-
220
-
221
-
222
-
223
-
224
-
225
-
226
-
227
-
228
-
229
-
230
-
231
-
232
-
233
-
234
-
235
-
236
-
237
-
238
-
239
-
240
-
241
-
242
-
243
-
244
-
245
-
246
-
247
-
248
 |
 |

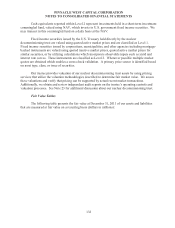
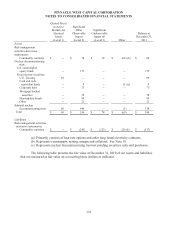
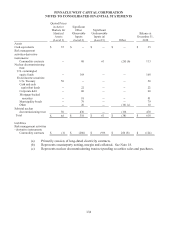
PINNACLE WEST CAPITAL CORPORATION
NOTES TO CONSOLIDATED FINANCIAL STATEMENTS
138
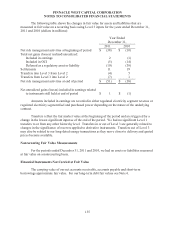
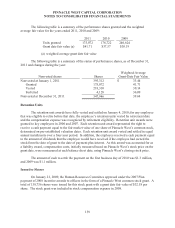
Nonvested shares
Shares
Weighted-Average
Grant-Date Fair Value
Nonvested at January 1, 2011 223,681 $ 35.69
Granted 293,242 41.98
Vested 98,362 37.84
Forfeited 2,330 37.93
Nonvested at December 31, 2011 416,231 39.61
The amount of cash required to settle the payments on restricted stock units is (dollars in
millions):
Year 2011 2010 2009
2007 Grant $1.0 $0.9 $0.8
2008 Grant 1.6 1.5 1.3
2009 Grant 1.5 1.4 --
2010 Grant 0.6 -- --
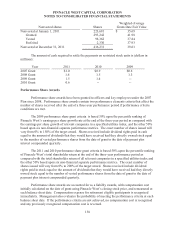
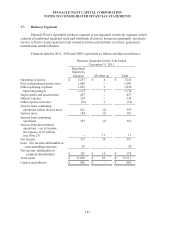
Performance Share Awards
Performance share awards have been granted to officers and key employees under the 2007
Plan since 2008. Performance share awards contain two performance elements criteria that affect the
number of shares received after the end of a three-year performance period if performance criteria
conditions are met.
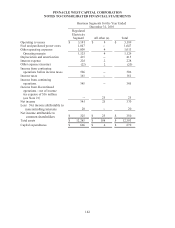
The 2009 performance share grant criteria is based 50% upon the percentile ranking of
Pinnacle West’s earnings per share growth rate at the end of the three-year period as compared with
the earnings per share growth of relevant companies in a specified utilities index, and the other 50%
based upon six non-financial separate performance metrics. The exact number of shares issued will
vary from 0% to 150% of the target award. Shares received include dividend rights paid in cash
equal to the amount of dividends that they would have received had they directly owned stock equal
to the number of vested performance shares from the date of grant to the date of payment plus
interest compounded quarterly.
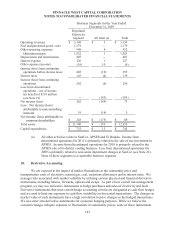
The 2011 and 2010 performance share grant criteria is based 50% upon the percentile ranking
of Pinnacle West’s total shareholder return at the end of the three-year performance period as
compared with the total shareholder return of all relevant companies in a specified utilities index and
the other 50% based upon six non-financial separate performance metrics. The exact number of
shares issued will vary from 0% to 200% of the target award. Shares received include dividend
rights paid in stock equal to the amount of dividends that they would have received had they directly
owned stock equal to the number of vested performance shares from the date of grant to the date of
payment plus interest compounded quarterly.
Performance share awards are accounted for as a liability awards, with compensation cost
initially calculated on the date of grant using Pinnacle West’s closing stock price, and remeasured at
each balance sheet date. Compensation expense for retirement eligible participants is recognized
immediately. Management also evaluates the probability of meeting the performance criteria at each
balance sheet date. If the performance criteria are not achieved, no compensation cost is recognized
and any previously recognized compensation cost is reversed.