The Hartford 2013 Annual Report Download - page 80
Download and view the complete annual report
Please find page 80 of the 2013 The Hartford annual report below. You can navigate through the pages in the report by either clicking on the pages listed below, or by using the keyword search tool below to find specific information within the annual report.-
 1
1 -
2
-
3
-
4
-
5
-
6
-
7
-
8
-
9
-
10
-
11
-
12
-
13
-
14
-
15
-
16
-
17
-
18
-
19
-
20
-
21
-
22
-
23
-
24
-
25
-
26
-
27
-
28
-
29
-
30
-
31
-
32
-
33
-
34
-
35
-
36
-
37
-
38
-
39
-
40
-
41
-
42
-
43
-
44
-
45
-
46
-
47
-
48
-
49
-
50
-
51
-
52
-
53
-
54
-
55
-
56
-
57
-
58
-
59
-
60
-
61
-
62
-
63
-
64
-
65
-
66
-
67
-
68
-
69
-
 70
70 -
 71
71 -
 72
72 -
 73
73 -
 74
74 -
 75
75 -
 76
76 -
 77
77 -
 78
78 -
 79
79 -
 80
80 -
 81
81 -
 82
82 -
 83
83 -
 84
84 -
 85
85 -
 86
86 -
 87
87 -
 88
88 -
 89
89 -
 90
90 -
91
-
92
-
93
-
94
-
95
-
96
-
97
-
98
-
99
-
100
-
101
-
102
-
103
-
104
-
105
-
106
-
107
-
108
-
109
-
110
-
111
-
112
-
113
-
114
-
115
-
116
-
117
-
118
-
119
-
120
-
121
-
122
-
123
-
124
-
125
-
126
-
127
-
128
-
129
-
130
-
131
-
132
-
133
-
134
-
135
-
136
-
137
-
138
-
139
-
140
-
141
-
142
-
143
-
144
-
145
-
146
-
147
-
148
-
149
-
150
-
151
-
152
-
153
-
154
-
155
-
156
-
157
-
158
-
159
-
160
-
161
-
162
-
163
-
164
-
165
-
166
-
167
-
168
-
169
-
170
-
171
-
172
-
173
-
174
-
175
-
176
-
177
-
178
-
179
-
180
-
181
-
182
-
183
-
184
-
185
-
186
-
187
-
188
-
189
-
190
-
191
-
192
-
193
-
194
-
195
-
196
-
197
-
198
-
199
-
200
-
201
-
202
-
203
-
204
-
205
-
206
-
207
-
208
-
209
-
210
-
211
-
212
-
213
-
214
-
215
-
216
-
217
-
218
-
219
-
220
-
221
-
222
-
223
-
224
-
225
-
226
-
227
-
228
-
229
-
230
-
231
-
232
-
233
-
234
-
235
-
236
-
237
-
238
-
239
-
240
-
241
-
242
-
243
-
244
-
245
-
246
-
247
-
248
-
249
-
250
 |
 |

80
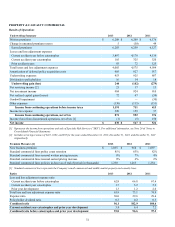
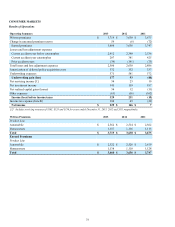
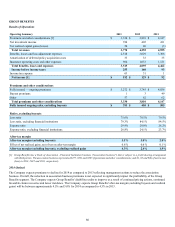
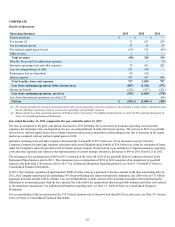
GROUP BENEFITS
Results of Operations
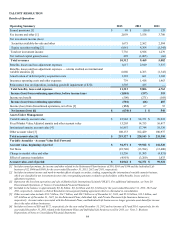
Operating Summary 2013 2012 2011
Premiums and other considerations [1] $ 3,330 $ 3,810 $ 4,147
Net investment income 390 405 411
Net realized capital gains (losses) 50 40 (3)
Total revenues 3,770 4,255 4,555
Benefits, losses and loss adjustment expenses 2,518 3,029 3,306
Amortization of deferred policy acquisition costs 33 33 35
Insurance operating costs and other expenses 964 1,033 1,121
Total benefits, losses and expenses 3,515 4,095 4,462
Income before income taxes 255 160 93
Income tax expense 63 31 1
Net income [1] $ 192 $ 129 $ 92
Premiums and other considerations
Fully insured — ongoing premiums $ 3,272 $ 3,745 $ 4,036
Buyout premiums 1 3 49
Other 57 62 62
Total premiums and other considerations 3,330 3,810 4,147
Fully insured ongoing sales, excluding buyouts $ 393 $ 405 $ 505
Ratios, excluding buyouts
Loss ratio 75.6% 79.5% 79.5%
Loss ratio, excluding financial institutions 79.3% 84.1% 84.5%
Expense ratio 29.9% 28.0% 28.2%
Expense ratio, excluding financial institutions 26.8% 24.1% 23.7%
After-tax margin
After-tax margin (excluding buyouts) 5.1% 3.0% 2.0%
Effect of net realized gains, net of tax on after-tax margin 0.8 % 0.6 % 0.1 %
After-tax margin (excluding buyouts), excluding realized gains 4.3% 2.4% 1.9%
[1] Group Benefits has a block of Association - Financial Institution business ("association business") that is subject to a profit sharing arrangement
with third parties. The association business represented $277, $321 and $367 of premiums and other considerations, and $1, $2 and $(6) of net income
(loss) in 2013, 2012 and 2011, respectively.
2014 Outlook
The Company expects premiums to decline for 2014 as compared to 2013 reflecting management actions to reduce the association
business. Overall, the reduction in association business premiums is not expected to significantly impact the profitability of the Group
Benefits segment. The Company expects Group Benefits' disability results to improve as a result of continued pricing actions, continued
favorable claim recoveries and lower incidence. The Company expects Group Benefits' after-tax margin (excluding buyouts and realized
gains) will be between approximately 4.5% and 5.0% for 2014 as compared to 4.3% in 2013.