The Hartford 2013 Annual Report Download - page 103
Download and view the complete annual report
Please find page 103 of the 2013 The Hartford annual report below. You can navigate through the pages in the report by either clicking on the pages listed below, or by using the keyword search tool below to find specific information within the annual report.-
 1
1 -
2
-
3
-
4
-
5
-
6
-
7
-
8
-
9
-
10
-
11
-
12
-
13
-
14
-
15
-
16
-
17
-
18
-
19
-
20
-
21
-
22
-
23
-
24
-
25
-
26
-
27
-
28
-
29
-
30
-
31
-
32
-
33
-
34
-
35
-
36
-
37
-
38
-
39
-
40
-
41
-
42
-
43
-
44
-
45
-
46
-
47
-
48
-
49
-
50
-
51
-
52
-
53
-
54
-
55
-
56
-
57
-
58
-
59
-
60
-
61
-
62
-
63
-
64
-
65
-
66
-
67
-
68
-
69
-
70
-
71
-
72
-
73
-
74
-
75
-
76
-
77
-
78
-
79
-
80
-
81
-
82
-
83
-
84
-
85
-
86
-
87
-
88
-
89
-
90
-
91
-
92
-
 93
93 -
 94
94 -
 95
95 -
 96
96 -
 97
97 -
 98
98 -
 99
99 -
 100
100 -
 101
101 -
 102
102 -
 103
103 -
 104
104 -
 105
105 -
 106
106 -
 107
107 -
 108
108 -
 109
109 -
 110
110 -
 111
111 -
 112
112 -
 113
113 -
114
-
115
-
116
-
117
-
118
-
119
-
120
-
121
-
122
-
123
-
124
-
125
-
126
-
127
-
128
-
129
-
130
-
131
-
132
-
133
-
134
-
135
-
136
-
137
-
138
-
139
-
140
-
141
-
142
-
143
-
144
-
145
-
146
-
147
-
148
-
149
-
150
-
151
-
152
-
153
-
154
-
155
-
156
-
157
-
158
-
159
-
160
-
161
-
162
-
163
-
164
-
165
-
166
-
167
-
168
-
169
-
170
-
171
-
172
-
173
-
174
-
175
-
176
-
177
-
178
-
179
-
180
-
181
-
182
-
183
-
184
-
185
-
186
-
187
-
188
-
189
-
190
-
191
-
192
-
193
-
194
-
195
-
196
-
197
-
198
-
199
-
200
-
201
-
202
-
203
-
204
-
205
-
206
-
207
-
208
-
209
-
210
-
211
-
212
-
213
-
214
-
215
-
216
-
217
-
218
-
219
-
220
-
221
-
222
-
223
-
224
-
225
-
226
-
227
-
228
-
229
-
230
-
231
-
232
-
233
-
234
-
235
-
236
-
237
-
238
-
239
-
240
-
241
-
242
-
243
-
244
-
245
-
246
-
247
-
248
-
249
-
250
 |
 |

103
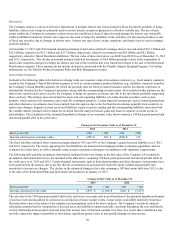
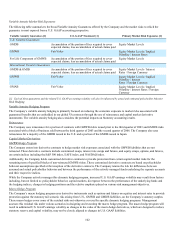
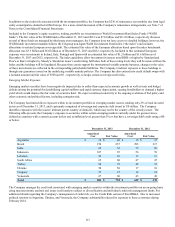
International Hedge Programs
The Company enters into derivative contracts to hedge market risk exposures associated with the guaranteed benefits which are
embedded in the international variable annuity contracts. These derivative contracts include foreign currency forwards and options,
interest rate swaps, swaptions and futures, and equity swaps, options, and futures on certain broadly traded global equity indices
including the S&P500 index, Nikkei 225 index, Topix index, FTSE 100 index, and Euro Stoxx 50. During 2013, the Company expanded
its hedging program to substantially reduce equity and foreign currency exchange risk. The program is primarily focused on the risks
that have been reinsured to the Company’s U.S. legal entities although certain hedges, predominantly options, are also held directly in
HLIKK.
While the Company actively manages these dynamic hedging programs, increased U.S. GAAP earnings volatility may result from
factors including, but not limited to: focus on reducing the economic exposure to market risks associated with guaranteed benefits,
capital markets, changes in hedging positions and the relative emphasis placed on various risk management objectives.
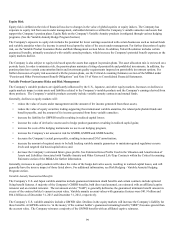
Variable Annuity Hedging Program Sensitivities
The following table presents the accounting treatment of the underlying guaranteed living benefits and the related hedge assets by hedge
program.
U.S. Programs International Programs
GMWB [1] Macro Japan
Hedge Assets Liabilities Hedge Assets Liabilities Hedge Assets Liabilities [2]
Fair Value Fair Value Fair Value Not Fair Value Fair Value Not Fair Value
[1] Excludes life contingent GMWB contracts.
[2] The liabilities for international variable annuity are primarily not measured on a fair value basis. However there is an immaterial portion of the
international variable annuity with a GMWB or GMAB which is measured on a fair value basis.
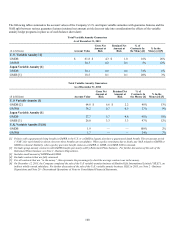
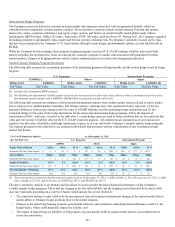
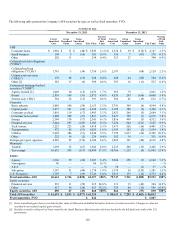
The following table presents our estimates of the potential instantaneous impacts from sudden market stresses related to equity market
prices, interest rates, implied market volatilities, and foreign currency exchange rates. The sensitivities below represent: (1) the net
estimated difference between the change in the fair value of GMWB liabilities and the underlying hedge instruments and (2) the
estimated change in fair value of the hedge instruments for the macro and international hedge programs, before the impacts of
amortization of DAC, and taxes. As noted in the table above, certain hedge assets are used to hedge liabilities that are not carried at fair
value and will not have a liability offset in the U.S. GAAP sensitivity analysis. All sensitivities are measured as of year end and are
related to the fair value of liabilities and hedge instruments in place as of year end for the Company’s variable annuity hedge programs.
The impacts presented in the table below are estimated individually and measured without consideration of any correlation among
market risk factors
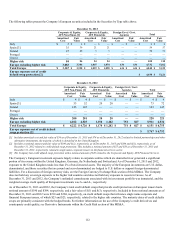
U.S. GAAP Sensitivity Analysis As of December 31, 2013
(pre Tax/DAC) [1] U.S. Programs International Program
GMWB Macro Japan
Equity Market Return (20)% (10)% 10 % (20)% (10)% 10 % (20)% (10)% 10 %
Potential Net Fair Value Impact $ 6 $ (1) $ 5 $ 62 $ 24 $ (19) $ 356 $ 172 $ (167)
Interest Rates -50bps -25bps 25bps -50bps -25bps 25bps -50bps -25bps 25bps
Potential Net Fair Value Impact $ 2 $ 3 $ (8) $ 16 $ 8 $ (8) $ (2) $ 6 $ (4)
Implied Volatilities 10 % 2 % (10)% 10 % 2 % (10)% 10 % 2 % (10)%
Potential Net Fair Value Impact $ 36 $ 7 $ (28) $ 66 $ 14 $ (75) $ 56 $ 10 $ (33)
Yen Strengthens +/ Weakens - 20 % 10 % (10)% 20 % 10 % (10)% 20 % 10 % (10)%
Potential Net Fair Value Impact N/A N/A N/A N/A N/A N/A $ 28 $ 5 $ (7)
[1] These sensitivities are based on the following key market levels as of December 31, 2013: 1) S&P of 1848; 2) 10yr US swap rate of 3.25%; 3) S&P
10yr volatility of 25.14% and 4) FX rates of USDJPY @ 105.31 and EURJPY @ 144.73
The above sensitivity analysis is an estimate and should not be used to predict the future financial performance of the Company's
variable annuity hedge programs. The actual net changes in the fair value liability and the hedging assets illustrated in the above table
may vary materially depending on a variety of factors which include but are not limited to:
• The sensitivity analysis is only valid as of the measurement date and assumes instantaneous changes in the capital market factors
and no ability to rebalance hedge positions prior to the market changes;
• Changes to the underlying hedging program, policyholder behavior, and variation in underlying fund performance relative to the
hedged index, which could materially impact the liability; and
• The impact of elapsed time on liabilities or hedge assets, any non-parallel shifts in capital market factors, or correlated moves
across the sensitivities.