The Hartford 2013 Annual Report Download - page 73
Download and view the complete annual report
Please find page 73 of the 2013 The Hartford annual report below. You can navigate through the pages in the report by either clicking on the pages listed below, or by using the keyword search tool below to find specific information within the annual report.-
 1
1 -
2
-
3
-
4
-
5
-
6
-
7
-
8
-
9
-
10
-
11
-
12
-
13
-
14
-
15
-
16
-
17
-
18
-
19
-
20
-
21
-
22
-
23
-
24
-
25
-
26
-
27
-
28
-
29
-
30
-
31
-
32
-
33
-
34
-
35
-
36
-
37
-
38
-
39
-
40
-
41
-
42
-
43
-
44
-
45
-
46
-
47
-
48
-
49
-
50
-
51
-
52
-
53
-
54
-
55
-
56
-
57
-
58
-
59
-
60
-
61
-
62
-
 63
63 -
 64
64 -
 65
65 -
 66
66 -
 67
67 -
 68
68 -
 69
69 -
 70
70 -
 71
71 -
 72
72 -
 73
73 -
 74
74 -
 75
75 -
 76
76 -
 77
77 -
 78
78 -
 79
79 -
 80
80 -
 81
81 -
 82
82 -
 83
83 -
84
-
85
-
86
-
87
-
88
-
89
-
90
-
91
-
92
-
93
-
94
-
95
-
96
-
97
-
98
-
99
-
100
-
101
-
102
-
103
-
104
-
105
-
106
-
107
-
108
-
109
-
110
-
111
-
112
-
113
-
114
-
115
-
116
-
117
-
118
-
119
-
120
-
121
-
122
-
123
-
124
-
125
-
126
-
127
-
128
-
129
-
130
-
131
-
132
-
133
-
134
-
135
-
136
-
137
-
138
-
139
-
140
-
141
-
142
-
143
-
144
-
145
-
146
-
147
-
148
-
149
-
150
-
151
-
152
-
153
-
154
-
155
-
156
-
157
-
158
-
159
-
160
-
161
-
162
-
163
-
164
-
165
-
166
-
167
-
168
-
169
-
170
-
171
-
172
-
173
-
174
-
175
-
176
-
177
-
178
-
179
-
180
-
181
-
182
-
183
-
184
-
185
-
186
-
187
-
188
-
189
-
190
-
191
-
192
-
193
-
194
-
195
-
196
-
197
-
198
-
199
-
200
-
201
-
202
-
203
-
204
-
205
-
206
-
207
-
208
-
209
-
210
-
211
-
212
-
213
-
214
-
215
-
216
-
217
-
218
-
219
-
220
-
221
-
222
-
223
-
224
-
225
-
226
-
227
-
228
-
229
-
230
-
231
-
232
-
233
-
234
-
235
-
236
-
237
-
238
-
239
-
240
-
241
-
242
-
243
-
244
-
245
-
246
-
247
-
248
-
249
-
250
 |
 |
73
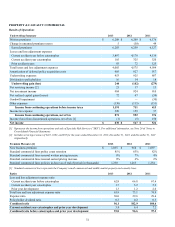
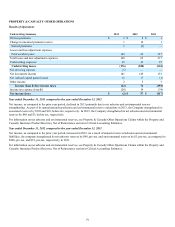
2014 Outlook
The Company expects market conditions to continue to improve slowly driving a modest increase in exposures, while pricing, which
should remain favorable in the near-term, is anticipated to moderate due to increased competition. As such, the Company expects low
single-digit written premiums growth in 2014, as compared to 2013, driven by small commercial and middle market where the Company
continues to develop comprehensive product solutions, deeper relationships with distribution partners, differentiating customer
experiences and ease of doing business processes and technologies. In specialty lines, the Company expects written premiums to decline
as the Company continues to streamline its programs business and adjusts the mix within professional liability. The Company expects
the combined ratio before catastrophes and prior accident year development will be between approximately 90.0 and 92.0 for 2014,
compared to 93.0 in 2013, due to continued margin expansion across all lines of business as expected earned pricing increases outpace
loss costs.
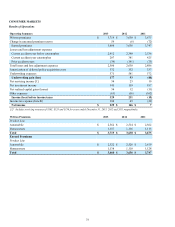
Year ended December 31, 2013 compared to the year ended December 31, 2012
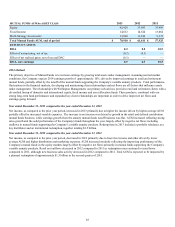
Net income, as compared to the prior year period, increased in 2013 primarily due to improvements in underwriting results, driven by
lower current accident year losses before catastrophes and lower current accident year catastrophe losses.
Earned premiums decreased in 2013, reflecting the impact of lower written premiums primarily in specialty lines and to a lesser extent in
middle market, partially offset by written premium growth in small commercial. Written premium increases in small commercial,
primarily in workers’ compensation business, were driven by favorable audit premium as well as favorable renewal premium due to
higher earned pricing, partially offset by lower policy count retention. Written premium decreases in middle market were driven
primarily by lower renewal premium in workers' compensation business partially offset by new business premium growth in property,
general liability and auto and favorable overall inforce policy retention. Written premium decreases in specialty lines were primarily the
result of underwriting actions to reposition business and exit unprofitable programs partially offset by new business growth in national
accounts. The Company ceased writing all transportation programs effective January 1, 2014.
Losses and loss adjustment expenses reflect favorable current accident year losses before catastrophes in all three businesses and a
significant decline in current accident year catastrophes partially offset by unfavorable prior accident years development.
• Favorable current accident year losses and loss adjustment expenses before catastrophes were primarily driven by lower loss
and loss adjustment expenses in workers’ compensation due to favorable severity and frequency. The current accident year loss
and loss adjustment expense ratio before catastrophes decreased accordingly by 4.0 points to 62.8 in 2013 from 66.8 in 2012.
• Current accident year catastrophe losses of $105, before tax, in 2013, compared to $325, before tax, in 2012. Losses in 2013
were primarily due to multiple thunderstorm, hail, and tornado events across various U.S. geographic regions. Losses in 2012
were primarily driven by $207 related to Storm Sandy and multiple thunderstorm, hail, and tornado events across various U.S.
geographic regions. For additional information, see MD&A - Critical Accounting Estimates, Property and Casualty Insurance
Product Reserves, Net of Reinsurance.
• Prior accident years reserve strengthening of $83, before tax, in 2013, compared to $72, before tax, in 2012. Development in
2013 was primarily due to strengthening related to commercial auto liability and the closing of the New York Section 25A Fund
for Reopened Cases partially offset by a release of general liability reserves. Development in 2012 was primarily due to
strengthening related to commercial auto liability claims, professional liability directors and officers claims and workers
compensation partially offset by a release of general liability and catastrophe reserves. For additional information, see MD&A -
Critical Accounting Estimates, Reserve Roll-forwards and Development.
The combined ratio, before catastrophes and prior year development, improved 3.6 points to 93.0 in 2013 from 96.6 in 2012. The
decrease primarily reflects a favorable decrease in the current accident year before catastrophes ratio.
The effective tax rate, in both periods, differs from the U.S. Federal statutory rate primarily due to permanent differences related to
investments in tax exempt securities. For further discussion of income taxes, see Note 14 - Income Taxes of Notes to Consolidated
Financial Statements.