The Hartford 2013 Annual Report Download - page 74
Download and view the complete annual report
Please find page 74 of the 2013 The Hartford annual report below. You can navigate through the pages in the report by either clicking on the pages listed below, or by using the keyword search tool below to find specific information within the annual report.-
 1
1 -
2
-
3
-
4
-
5
-
6
-
7
-
8
-
9
-
10
-
11
-
12
-
13
-
14
-
15
-
16
-
17
-
18
-
19
-
20
-
21
-
22
-
23
-
24
-
25
-
26
-
27
-
28
-
29
-
30
-
31
-
32
-
33
-
34
-
35
-
36
-
37
-
38
-
39
-
40
-
41
-
42
-
43
-
44
-
45
-
46
-
47
-
48
-
49
-
50
-
51
-
52
-
53
-
54
-
55
-
56
-
57
-
58
-
59
-
60
-
61
-
62
-
63
-
 64
64 -
 65
65 -
 66
66 -
 67
67 -
 68
68 -
 69
69 -
 70
70 -
 71
71 -
 72
72 -
 73
73 -
 74
74 -
 75
75 -
 76
76 -
 77
77 -
 78
78 -
 79
79 -
 80
80 -
 81
81 -
 82
82 -
 83
83 -
 84
84 -
85
-
86
-
87
-
88
-
89
-
90
-
91
-
92
-
93
-
94
-
95
-
96
-
97
-
98
-
99
-
100
-
101
-
102
-
103
-
104
-
105
-
106
-
107
-
108
-
109
-
110
-
111
-
112
-
113
-
114
-
115
-
116
-
117
-
118
-
119
-
120
-
121
-
122
-
123
-
124
-
125
-
126
-
127
-
128
-
129
-
130
-
131
-
132
-
133
-
134
-
135
-
136
-
137
-
138
-
139
-
140
-
141
-
142
-
143
-
144
-
145
-
146
-
147
-
148
-
149
-
150
-
151
-
152
-
153
-
154
-
155
-
156
-
157
-
158
-
159
-
160
-
161
-
162
-
163
-
164
-
165
-
166
-
167
-
168
-
169
-
170
-
171
-
172
-
173
-
174
-
175
-
176
-
177
-
178
-
179
-
180
-
181
-
182
-
183
-
184
-
185
-
186
-
187
-
188
-
189
-
190
-
191
-
192
-
193
-
194
-
195
-
196
-
197
-
198
-
199
-
200
-
201
-
202
-
203
-
204
-
205
-
206
-
207
-
208
-
209
-
210
-
211
-
212
-
213
-
214
-
215
-
216
-
217
-
218
-
219
-
220
-
221
-
222
-
223
-
224
-
225
-
226
-
227
-
228
-
229
-
230
-
231
-
232
-
233
-
234
-
235
-
236
-
237
-
238
-
239
-
240
-
241
-
242
-
243
-
244
-
245
-
246
-
247
-
248
-
249
-
250
 |
 |
74
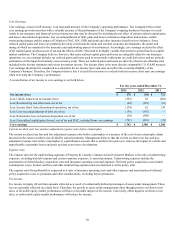
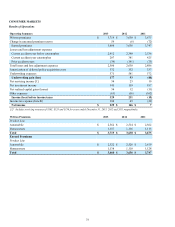
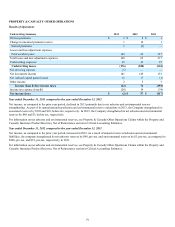
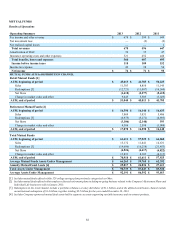
Year ended December 31, 2012 compared to the year ended December 31, 2011
Net income, as compared to the prior year period, increased in 2012 primarily due to improvements in underwriting results, driven by an
increase in earned premiums and lower unfavorable prior year development, and improvements in net realized capital gains (losses),
mainly on derivatives. This was offset by the gain on sale of SRS which occurred in 2011.
Earned premiums increased in 2012 primarily due to improvements in workers’ compensation, driven by renewal earned pricing
increases, strong policy count retention and an increase in policies-in-force. The earned pricing changes were primarily a reflection of
written pricing changes over the last year. Renewal written pricing increased across all standard commercial lines driven by improving
market conditions.
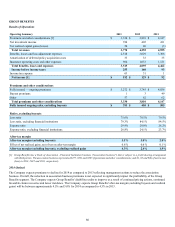
Losses and loss adjustment expenses reflect less unfavorable prior accident years development partially offset by unfavorable current
accident year losses before catastrophes.
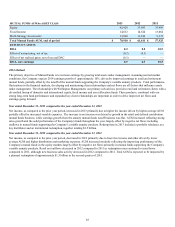
• Current accident year catastrophe losses of $325, before tax, in 2012, compared to $320, before tax, in 2011. Losses in 2012
were primarily driven by $207 related to Storm Sandy and multiple thunderstorm, hail, and tornado events across various U.S.
geographic regions. Losses in 2011 were primarily driven by $60 related to Hurricane Irene and multiple tornado, winter storm,
and thunderstorm events across various U.S. geographic regions. For additional information, see MD&A - Critical Accounting
Estimates, Property and Casualty Insurance Product Reserves, Net of Reinsurance.
• Prior accident years reserve strengthening of $72, before tax, in 2012, compared to $125, before tax, in 2011. The decline in
unfavorable prior year development was primarily due to lower strengthening on workers' compensation reserves. For
additional information, see MD&A - Critical Accounting Estimates, Reserve Roll-forwards and Development.
The combined ratio, before catastrophes and prior year development, improved 0.7 points to 96.6 in 2012 from 97.3 in 2011. The
improvement in the ratio primarily reflects lower non-catastrophe property losses. In addition, workers' compensation frequency
improved in 2012, while severity moderated and earned pricing increased.
The effective tax rate, in both periods, differs from the U.S. Federal statutory rate primarily due to permanent differences related to
investments in tax exempt securities. In addition, due to the availability of additional tax planning strategies, the Company released the
valuation allowance associated with investment realized capital losses in 2011. For further discussion of income taxes, see Note 14 -
Income Taxes of Notes to Consolidated Financial Statements.