The Hartford 2013 Annual Report Download - page 109
Download and view the complete annual report
Please find page 109 of the 2013 The Hartford annual report below. You can navigate through the pages in the report by either clicking on the pages listed below, or by using the keyword search tool below to find specific information within the annual report.-
 1
1 -
2
-
3
-
4
-
5
-
6
-
7
-
8
-
9
-
10
-
11
-
12
-
13
-
14
-
15
-
16
-
17
-
18
-
19
-
20
-
21
-
22
-
23
-
24
-
25
-
26
-
27
-
28
-
29
-
30
-
31
-
32
-
33
-
34
-
35
-
36
-
37
-
38
-
39
-
40
-
41
-
42
-
43
-
44
-
45
-
46
-
47
-
48
-
49
-
50
-
51
-
52
-
53
-
54
-
55
-
56
-
57
-
58
-
59
-
60
-
61
-
62
-
63
-
64
-
65
-
66
-
67
-
68
-
69
-
70
-
71
-
72
-
73
-
74
-
75
-
76
-
77
-
78
-
79
-
80
-
81
-
82
-
83
-
84
-
85
-
86
-
87
-
88
-
89
-
90
-
91
-
92
-
93
-
94
-
95
-
96
-
97
-
98
-
 99
99 -
 100
100 -
 101
101 -
 102
102 -
 103
103 -
 104
104 -
 105
105 -
 106
106 -
 107
107 -
 108
108 -
 109
109 -
 110
110 -
 111
111 -
 112
112 -
 113
113 -
 114
114 -
 115
115 -
 116
116 -
 117
117 -
 118
118 -
 119
119 -
120
-
121
-
122
-
123
-
124
-
125
-
126
-
127
-
128
-
129
-
130
-
131
-
132
-
133
-
134
-
135
-
136
-
137
-
138
-
139
-
140
-
141
-
142
-
143
-
144
-
145
-
146
-
147
-
148
-
149
-
150
-
151
-
152
-
153
-
154
-
155
-
156
-
157
-
158
-
159
-
160
-
161
-
162
-
163
-
164
-
165
-
166
-
167
-
168
-
169
-
170
-
171
-
172
-
173
-
174
-
175
-
176
-
177
-
178
-
179
-
180
-
181
-
182
-
183
-
184
-
185
-
186
-
187
-
188
-
189
-
190
-
191
-
192
-
193
-
194
-
195
-
196
-
197
-
198
-
199
-
200
-
201
-
202
-
203
-
204
-
205
-
206
-
207
-
208
-
209
-
210
-
211
-
212
-
213
-
214
-
215
-
216
-
217
-
218
-
219
-
220
-
221
-
222
-
223
-
224
-
225
-
226
-
227
-
228
-
229
-
230
-
231
-
232
-
233
-
234
-
235
-
236
-
237
-
238
-
239
-
240
-
241
-
242
-
243
-
244
-
245
-
246
-
247
-
248
-
249
-
250
 |
 |

109
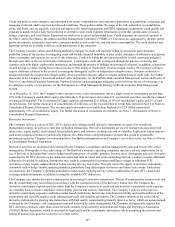
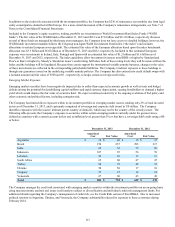
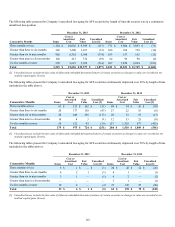
Investment Portfolio Risks and Risk Management
Investment Portfolio Composition
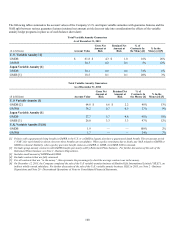
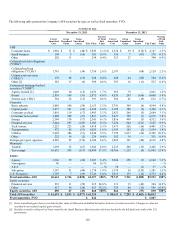
The following table presents the Company’s fixed maturities, AFS, by credit quality. The average credit ratings referenced below and
throughout this section are based on availability and the midpoint of the applicable ratings among Moody’s, S&P, Fitch and Morningstar.
If no rating is available from a rating agency, then an internally developed rating is used.
Fixed Maturities by Credit Quality
December 31, 2013 December 31, 2012
Amortized
Cost Fair
Value
Percent of
Total Fair
Value Amortized
Cost Fair Value
Percent of
Total Fair
Value
United States Government/Government agencies $ 8,231 $ 8,208 13.2 % $ 10,481 $ 10,975 12.8 %
AAA 6,215 6,376 10.2 % 8,646 9,220 10.7 %
AA 12,054 12,273 19.7 % 14,939 16,104 18.7 %
A 14,777 15,498 24.9 % 20,396 22,650 26.4 %
BBB 15,555 16,087 25.7 % 20,833 22,689 26.4 %
BB & below 3,809 3,915 6.3% 4,452 4,284 5.0 %
Total fixed maturities, AFS $ 60,641 62,357 100% $ 79,747 85,922 100%
The movement in the overall credit quality of the Company’s portfolio was primarily attributable to the sale of the Retirement Plans and
Individual Life businesses in January 2013. Refer to Note 2 - Business Dispositions of Notes to Consolidated Financial Statements for
further discussion of these transactions. Excluding the impact of the sales, United States government and government agencies declined
due to the sale of agency RMBS securities associated with the termination of repurchase agreements, see Note 6 - Investments and
Derivative Instruments of Notes to Consolidated Financial Statements. Fixed maturities, FVO, are not included in the above table. For
further discussion on fair value option securities, see Note 5 - Fair Value Measurements of Notes to Consolidated Financial Statements.