The Hartford 2013 Annual Report Download - page 181
Download and view the complete annual report
Please find page 181 of the 2013 The Hartford annual report below. You can navigate through the pages in the report by either clicking on the pages listed below, or by using the keyword search tool below to find specific information within the annual report.-
 1
1 -
2
-
3
-
4
-
5
-
6
-
7
-
8
-
9
-
10
-
11
-
12
-
13
-
14
-
15
-
16
-
17
-
18
-
19
-
20
-
21
-
22
-
23
-
24
-
25
-
26
-
27
-
28
-
29
-
30
-
31
-
32
-
33
-
34
-
35
-
36
-
37
-
38
-
39
-
40
-
41
-
42
-
43
-
44
-
45
-
46
-
47
-
48
-
49
-
50
-
51
-
52
-
53
-
54
-
55
-
56
-
57
-
58
-
59
-
60
-
61
-
62
-
63
-
64
-
65
-
66
-
67
-
68
-
69
-
70
-
71
-
72
-
73
-
74
-
75
-
76
-
77
-
78
-
79
-
80
-
81
-
82
-
83
-
84
-
85
-
86
-
87
-
88
-
89
-
90
-
91
-
92
-
93
-
94
-
95
-
96
-
97
-
98
-
99
-
100
-
101
-
102
-
103
-
104
-
105
-
106
-
107
-
108
-
109
-
110
-
111
-
112
-
113
-
114
-
115
-
116
-
117
-
118
-
119
-
120
-
121
-
122
-
123
-
124
-
125
-
126
-
127
-
128
-
129
-
130
-
131
-
132
-
133
-
134
-
135
-
136
-
137
-
138
-
139
-
140
-
141
-
142
-
143
-
144
-
145
-
146
-
147
-
148
-
149
-
150
-
151
-
152
-
153
-
154
-
155
-
156
-
157
-
158
-
159
-
160
-
161
-
162
-
163
-
164
-
165
-
166
-
167
-
168
-
169
-
170
-
 171
171 -
 172
172 -
 173
173 -
 174
174 -
 175
175 -
 176
176 -
 177
177 -
 178
178 -
 179
179 -
 180
180 -
 181
181 -
 182
182 -
 183
183 -
 184
184 -
 185
185 -
 186
186 -
 187
187 -
 188
188 -
 189
189 -
 190
190 -
 191
191 -
192
-
193
-
194
-
195
-
196
-
197
-
198
-
199
-
200
-
201
-
202
-
203
-
204
-
205
-
206
-
207
-
208
-
209
-
210
-
211
-
212
-
213
-
214
-
215
-
216
-
217
-
218
-
219
-
220
-
221
-
222
-
223
-
224
-
225
-
226
-
227
-
228
-
229
-
230
-
231
-
232
-
233
-
234
-
235
-
236
-
237
-
238
-
239
-
240
-
241
-
242
-
243
-
244
-
245
-
246
-
247
-
248
-
249
-
250
 |
 |

F-45
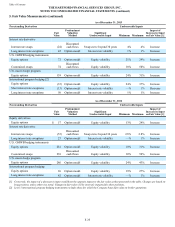
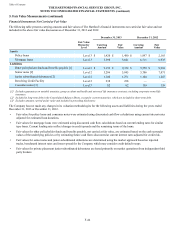
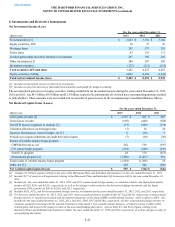
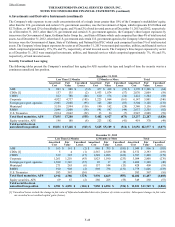
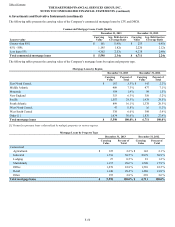
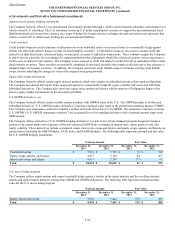
6. Investments and Derivative Instruments
Net Investment Income (Loss)
For the years ended December 31,
(Before-tax) 2013 2012 2011
Fixed maturities [1] $ 2,623 $ 3,352 $ 3,382
Equity securities, AFS 30 37 36
Mortgage loans 262 337 281
Policy loans 83 119 131
Limited partnerships and other alternative investments 287 196 243
Other investments [2] 200 297 305
Investment expenses (123)(111) (115)
Total securities AFS and other 3,362 4,227 4,263
Equity securities, trading 6,061 4,364 (1,345)
Total net investment income (loss) $ 9,423 $ 8,591 $ 2,918
[1] Includes net investment income on short-term investments.
[2] Includes income from derivatives that hedge fixed maturities and qualify for hedge accounting.
The net unrealized gain (loss) on equity securities, trading, included in net investment income during the years ended December 31, 2013,
2012 and 2011, was $4.1 billion, $4.5 billion and $(1.3) billion, respectively, substantially all of which have corresponding amounts credited
to policyholders. These amounts were not included in net unrealized gains (losses) in the accompanying Consolidated Balance Sheets.
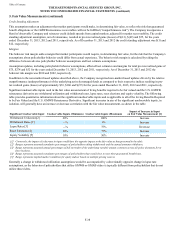
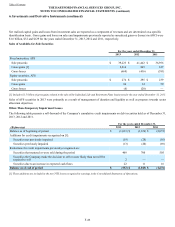
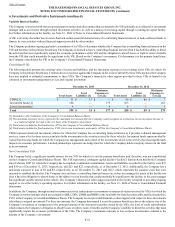
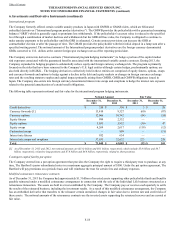
Net Realized Capital Gains (Losses)
For the years ended December 31,
(Before-tax) 2013 2012 2011
Gross gains on sales [1] $ 2,387 $ 821 $ 687
Gross losses on sales (692)(440) (384)
Net OTTI losses recognized in earnings [2] (73)(349) (174)
Valuation allowances on mortgage loans (1) 14 24
Japanese fixed annuity contract hedges, net [3] 6 (36) 3
Periodic net coupon settlements on credit derivatives/Japan (7)(10) (10)
Results of variable annuity hedge program
GMWB derivatives, net 262 519 (397)
U.S. macro hedge program (234)(340) (216)
Total U.S. program 28 179 (613)
International program [4] (1,586)(1,467) 691
Total results of variable annuity hedge program (1,558)(1,288) 78
Other, net [5] 445 544 (450)
Net realized capital gains (losses) $ 507 $ (744) $ (226)
[1] Includes $1.5 billion of gains relating to the sales of the Retirement Plans and Individual Life businesses in the year ended December 31, 2013.
[2] Includes $177 of intent-to-sell impairments relating to the Retirement Plans and Individual Life businesses sold for the year ended December 31,
2012.
[3] Includes for the years ended December 31, 2013, 2012, and 2011, transactional foreign currency re-valuation related to the Japan fixed annuity
product of $324, $245, and $(129) , respectively, as well as the change in value related to the derivative hedging instruments and the Japan
government FVO securities of $(318), $(281), and $132, respectively.
[4] Includes $(57), $(72), and $0 of transactional foreign currency re-valuation for the years ended December 31, 2013, 2012, and 2011, respectively.
[5] For the years ended December 31, 2013, 2012, and 2011, other, net gains and losses includes $240, $273 and ($129), respectively, of transactional
foreign currency re-valuation associated with the internal reinsurance of the Japan GMIB variable annuity business, which is offset in AOCI. Also
includes for the years ended December 31, 2013, 2012, and 2011, $248, $167 and ($101), respectively, of other transactional foreign currency re-
valuation, primarily associated with the internal reinsurance of the Japan 3 wins variable annuity business, of which a portion is offset within
realized gains and losses by the change in value of the associated hedging derivatives. Also includes $71 and $110 of gains relating to the
Retirement Plans and Individual Life businesses sold for the years ended December 31, 2013 and 2012, respectively, as well as changes in value of
non-qualifying derivatives.
Table of Contents THE HARTFORD FINANCIAL SERVICES GROUP, INC.
NOTES TO CONSOLIDATED FINANCIAL STATEMENTS (continued)