The Hartford 2013 Annual Report Download - page 242
Download and view the complete annual report
Please find page 242 of the 2013 The Hartford annual report below. You can navigate through the pages in the report by either clicking on the pages listed below, or by using the keyword search tool below to find specific information within the annual report.-
 1
1 -
2
-
3
-
4
-
5
-
6
-
7
-
8
-
9
-
10
-
11
-
12
-
13
-
14
-
15
-
16
-
17
-
18
-
19
-
20
-
21
-
22
-
23
-
24
-
25
-
26
-
27
-
28
-
29
-
30
-
31
-
32
-
33
-
34
-
35
-
36
-
37
-
38
-
39
-
40
-
41
-
42
-
43
-
44
-
45
-
46
-
47
-
48
-
49
-
50
-
51
-
52
-
53
-
54
-
55
-
56
-
57
-
58
-
59
-
60
-
61
-
62
-
63
-
64
-
65
-
66
-
67
-
68
-
69
-
70
-
71
-
72
-
73
-
74
-
75
-
76
-
77
-
78
-
79
-
80
-
81
-
82
-
83
-
84
-
85
-
86
-
87
-
88
-
89
-
90
-
91
-
92
-
93
-
94
-
95
-
96
-
97
-
98
-
99
-
100
-
101
-
102
-
103
-
104
-
105
-
106
-
107
-
108
-
109
-
110
-
111
-
112
-
113
-
114
-
115
-
116
-
117
-
118
-
119
-
120
-
121
-
122
-
123
-
124
-
125
-
126
-
127
-
128
-
129
-
130
-
131
-
132
-
133
-
134
-
135
-
136
-
137
-
138
-
139
-
140
-
141
-
142
-
143
-
144
-
145
-
146
-
147
-
148
-
149
-
150
-
151
-
152
-
153
-
154
-
155
-
156
-
157
-
158
-
159
-
160
-
161
-
162
-
163
-
164
-
165
-
166
-
167
-
168
-
169
-
170
-
171
-
172
-
173
-
174
-
175
-
176
-
177
-
178
-
179
-
180
-
181
-
182
-
183
-
184
-
185
-
186
-
187
-
188
-
189
-
190
-
191
-
192
-
193
-
194
-
195
-
196
-
197
-
198
-
199
-
200
-
201
-
202
-
203
-
204
-
205
-
206
-
207
-
208
-
209
-
210
-
211
-
212
-
213
-
214
-
215
-
216
-
217
-
218
-
219
-
220
-
221
-
222
-
223
-
224
-
225
-
226
-
227
-
228
-
229
-
230
-
231
-
 232
232 -
 233
233 -
 234
234 -
 235
235 -
 236
236 -
 237
237 -
 238
238 -
 239
239 -
 240
240 -
 241
241 -
 242
242 -
 243
243 -
 244
244 -
 245
245 -
 246
246 -
 247
247 -
 248
248 -
 249
249 -
 250
250
 |
 |

S-4
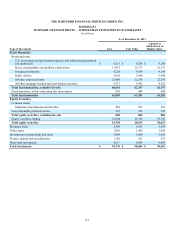
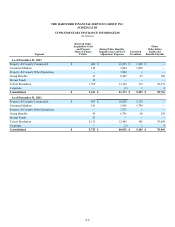
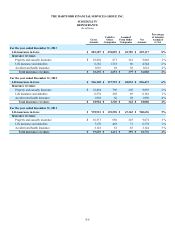
THE HARTFORD FINANCIAL SERVICES GROUP, INC.
SCHEDULE III
SUPPLEMENTARY INSURANCE INFORMATION
(In millions)
Segment
Deferred Policy
Acquisition Costs
and Present
Value of Future
Profits
Future Policy Benefits,
Unpaid Losses and Loss
Adjustment Expenses Unearned
Premiums
Other
Policyholder
Funds and
Benefits Payable
As of December 31, 2013
Property & Casualty Commercial $ 404 $ 16,293 $ 3,188 $ —
Consumer Markets 145 1,864 1,858 —
Property & Casualty Other Operations — 3,548 1 —
Group Benefits 41 6,547 65 188
Mutual Funds 19 — — —
Talcott Resolution 1,552 13,122 112 58,571
Corporate — (1) 1 4
Consolidated $ 2,161 $ 41,373 $ 5,225 $ 58,763
As of December 31, 2012
Property & Casualty Commercial $ 407 $ 16,020 3,170 —
Consumer Markets 141 1,926 1,799 —
Property & Casualty Other Operations — 3,771 1 —
Group Benefits 43 6,791 68 228
Mutual Funds 22 — — —
Talcott Resolution 5,112 12,485 106 70,669
Corporate — (1) 1 4
Consolidated $ 5,725 $ 40,992 $ 5,145 $ 70,901