The Hartford 2013 Annual Report Download - page 128
Download and view the complete annual report
Please find page 128 of the 2013 The Hartford annual report below. You can navigate through the pages in the report by either clicking on the pages listed below, or by using the keyword search tool below to find specific information within the annual report.-
 1
1 -
2
-
3
-
4
-
5
-
6
-
7
-
8
-
9
-
10
-
11
-
12
-
13
-
14
-
15
-
16
-
17
-
18
-
19
-
20
-
21
-
22
-
23
-
24
-
25
-
26
-
27
-
28
-
29
-
30
-
31
-
32
-
33
-
34
-
35
-
36
-
37
-
38
-
39
-
40
-
41
-
42
-
43
-
44
-
45
-
46
-
47
-
48
-
49
-
50
-
51
-
52
-
53
-
54
-
55
-
56
-
57
-
58
-
59
-
60
-
61
-
62
-
63
-
64
-
65
-
66
-
67
-
68
-
69
-
70
-
71
-
72
-
73
-
74
-
75
-
76
-
77
-
78
-
79
-
80
-
81
-
82
-
83
-
84
-
85
-
86
-
87
-
88
-
89
-
90
-
91
-
92
-
93
-
94
-
95
-
96
-
97
-
98
-
99
-
100
-
101
-
102
-
103
-
104
-
105
-
106
-
107
-
108
-
109
-
110
-
111
-
112
-
113
-
114
-
115
-
116
-
117
-
 118
118 -
 119
119 -
 120
120 -
 121
121 -
 122
122 -
 123
123 -
 124
124 -
 125
125 -
 126
126 -
 127
127 -
 128
128 -
 129
129 -
 130
130 -
 131
131 -
 132
132 -
 133
133 -
 134
134 -
 135
135 -
 136
136 -
 137
137 -
 138
138 -
139
-
140
-
141
-
142
-
143
-
144
-
145
-
146
-
147
-
148
-
149
-
150
-
151
-
152
-
153
-
154
-
155
-
156
-
157
-
158
-
159
-
160
-
161
-
162
-
163
-
164
-
165
-
166
-
167
-
168
-
169
-
170
-
171
-
172
-
173
-
174
-
175
-
176
-
177
-
178
-
179
-
180
-
181
-
182
-
183
-
184
-
185
-
186
-
187
-
188
-
189
-
190
-
191
-
192
-
193
-
194
-
195
-
196
-
197
-
198
-
199
-
200
-
201
-
202
-
203
-
204
-
205
-
206
-
207
-
208
-
209
-
210
-
211
-
212
-
213
-
214
-
215
-
216
-
217
-
218
-
219
-
220
-
221
-
222
-
223
-
224
-
225
-
226
-
227
-
228
-
229
-
230
-
231
-
232
-
233
-
234
-
235
-
236
-
237
-
238
-
239
-
240
-
241
-
242
-
243
-
244
-
245
-
246
-
247
-
248
-
249
-
250
 |
 |

128
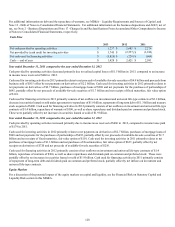
For additional information on debt and the repurchase of warrants, see MD&A – Liquidity Requirements and Sources of Capital, and
Note 13 - Debt of Notes to Consolidated Financial Statements. For additional information on the business dispositions and AOCI, net of
tax, see Note 2 - Business Dispositions and Note 17 -Changes In and Reclassifications From Accumulated Other Comprehensive Income
of Notes to Consolidated Financial Statements, respectively.
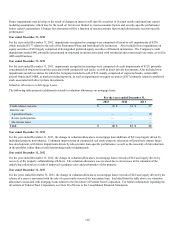
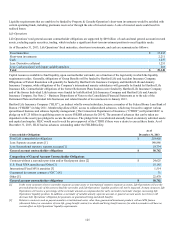
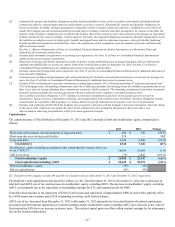
Cash Flow
2013 2012 2011
Net cash provided by operating activities $ 1,237 $ 2,681 $ 2,274
Net provided by (cash used) for investing activities $ 3,745 $ (2,557) $ (1,182)
Net cash used for financing activities $ (5,820) $ (228) $ (609)
Cash — end of year $ 1,428 $ 2,421 $ 2,581
Year ended December 31, 2013 compared to the year ended December 31, 2012
Cash provided by operating activities decreased primarily due to realized capital losses of $1.5 billion in 2013, compared to an increase
in income taxes received of $486 in 2012.
Cash used for investing activities in 2013 primarily relates to net proceeds of available-for-sale securities of $4.9 billion and proceeds from
business sold of $815 offset by net payments on derivatives of $2.2 billion. Cash used for investing activities in 2012 primarily relates to
net payments on derivatives of $2.7 billion, purchases of mortgage loans of $968 and net payments for the purchases of partnerships of
$695, partially offset by net proceeds of available-for-sale securities of $1.7 billion and net receipts of fixed maturities, fair value option
of $101.
Cash used for financing activities in 2013 primarily consists of net outflows on investment and universal life-type contracts of $2.1 billion,
decrease in securities loaned or sold under agreements to repurchase of $1.9 billion, repayment of long term debt of $ 1.3 billion and treasury
stock acquired of $600. Cash used for financing activities in 2012 primarily consists of net outflows on investment and universal life-type
contracts of $1.4 billion, repurchase of warrants of $300, as well as share repurchases and dividends paid on common and preferred stock.
These were partially offset by net increases in securities loaned or sold of $1.9 billion.
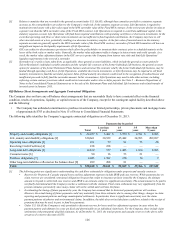
Year ended December 31, 2012 compared to the year ended December 31, 2011
Cash provided by operating activities increased primarily due to income taxes received of $486 in 2012, compared to income taxes paid
of $179 in 2011.
Cash used for investing activities in 2012 primarily relates to net payments on derivatives of $2.7 billion, purchases of mortgage loans of
$968 and net payments for the purchases of partnerships of $695, partially offset by net proceeds of available-for-sale securities of $1.7
billion and net receipts of fixed maturities, fair value option of $101. Cash used for investing activities in 2011 primarily relates to net
purchases of mortgage loans of $1.3 billion and net purchases of fixed maturities, fair value option of $627, partially offset by net
receipts on derivatives of $720 and net proceeds of available-for-sale securities of $256.
Cash used for financing activities in 2012 primarily consists of net outflows on investment and universal life-type contracts of $1.4
billion, repurchase of warrants of $300, as well as share repurchases and dividends paid on common and preferred stock. These were
partially offset by net increases in securities loaned or sold of $1.9 billion. Cash used for financing activities in 2011 primarily consists
of repayment of long-term debt and dividends paid on common and preferred stock, partially offset by net inflows on investment and
universal life-type contracts.
Equity Markets
For a discussion of the potential impact of the equity markets on capital and liquidity, see the Financial Risk on Statutory Capital and
Liquidity Risk section in this MD&A.