The Hartford 2013 Annual Report Download - page 56
Download and view the complete annual report
Please find page 56 of the 2013 The Hartford annual report below. You can navigate through the pages in the report by either clicking on the pages listed below, or by using the keyword search tool below to find specific information within the annual report.-
 1
1 -
2
-
3
-
4
-
5
-
6
-
7
-
8
-
9
-
10
-
11
-
12
-
13
-
14
-
15
-
16
-
17
-
18
-
19
-
20
-
21
-
22
-
23
-
24
-
25
-
26
-
27
-
28
-
29
-
30
-
31
-
32
-
33
-
34
-
35
-
36
-
37
-
38
-
39
-
40
-
41
-
42
-
43
-
44
-
45
-
 46
46 -
 47
47 -
 48
48 -
 49
49 -
 50
50 -
 51
51 -
 52
52 -
 53
53 -
 54
54 -
 55
55 -
 56
56 -
 57
57 -
 58
58 -
 59
59 -
 60
60 -
 61
61 -
 62
62 -
 63
63 -
 64
64 -
 65
65 -
 66
66 -
67
-
68
-
69
-
70
-
71
-
72
-
73
-
74
-
75
-
76
-
77
-
78
-
79
-
80
-
81
-
82
-
83
-
84
-
85
-
86
-
87
-
88
-
89
-
90
-
91
-
92
-
93
-
94
-
95
-
96
-
97
-
98
-
99
-
100
-
101
-
102
-
103
-
104
-
105
-
106
-
107
-
108
-
109
-
110
-
111
-
112
-
113
-
114
-
115
-
116
-
117
-
118
-
119
-
120
-
121
-
122
-
123
-
124
-
125
-
126
-
127
-
128
-
129
-
130
-
131
-
132
-
133
-
134
-
135
-
136
-
137
-
138
-
139
-
140
-
141
-
142
-
143
-
144
-
145
-
146
-
147
-
148
-
149
-
150
-
151
-
152
-
153
-
154
-
155
-
156
-
157
-
158
-
159
-
160
-
161
-
162
-
163
-
164
-
165
-
166
-
167
-
168
-
169
-
170
-
171
-
172
-
173
-
174
-
175
-
176
-
177
-
178
-
179
-
180
-
181
-
182
-
183
-
184
-
185
-
186
-
187
-
188
-
189
-
190
-
191
-
192
-
193
-
194
-
195
-
196
-
197
-
198
-
199
-
200
-
201
-
202
-
203
-
204
-
205
-
206
-
207
-
208
-
209
-
210
-
211
-
212
-
213
-
214
-
215
-
216
-
217
-
218
-
219
-
220
-
221
-
222
-
223
-
224
-
225
-
226
-
227
-
228
-
229
-
230
-
231
-
232
-
233
-
234
-
235
-
236
-
237
-
238
-
239
-
240
-
241
-
242
-
243
-
244
-
245
-
246
-
247
-
248
-
249
-
250
 |
 |

56
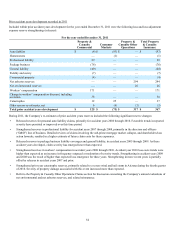
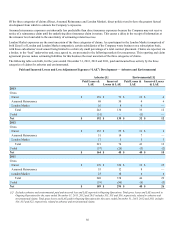
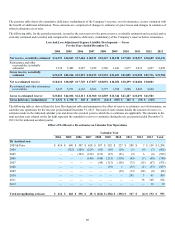
Of the three categories of claims (Direct, Assumed Reinsurance and London Market), direct policies tend to have the greatest factual
development from which to estimate the Company’s exposures.
Assumed reinsurance exposures are inherently less predictable than direct insurance exposures because the Company may not receive
notice of a reinsurance claim until the underlying direct insurance claim is mature. This causes a delay in the receipt of information at
the reinsurer level and adds to the uncertainty of estimating related reserves.
London Market exposures are the most uncertain of the three categories of claims. As a participant in the London Market (comprised of
both Lloyd’s of London and London Market companies), certain subsidiaries of the Company wrote business on a subscription basis,
with those subsidiaries’ involvement being limited to a relatively small percentage of a total contract placement. Claims are reported, via
a broker, to the “lead” underwriter and, once agreed to, are presented to the following markets for concurrence. This reporting and claim
agreement process makes estimating liabilities for this business the most uncertain of the three categories of claims.
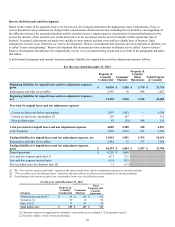
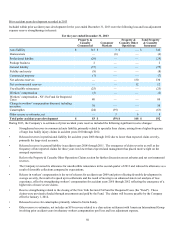
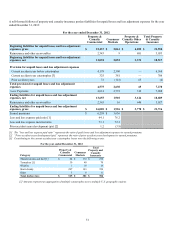
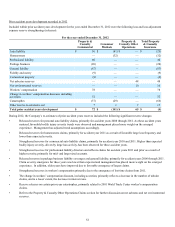
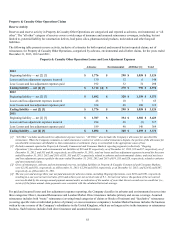
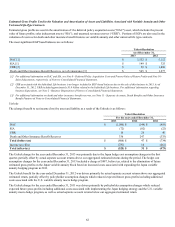
The following table sets forth, for the years ended December 31, 2013, 2012 and 2011, paid and incurred loss activity by the three
categories of claims for asbestos and environmental.
Paid and Incurred Losses and Loss Adjustment Expenses (“LAE”) Development — Asbestos and Environmental
Asbestos [1] Environmental [1]
Paid Losses &
LAE Incurred
Losses & LAE Paid Losses &
LAE Incurred Losses
& LAE
2013
Gross
Direct $ 159 $ 72 $ 23 $ 6
Assumed Reinsurance 68 50 4 6
London Market 16 8 6 —
Total 243 130 33 12
Ceded (51) — (1) —
Net $ 192 $ 130 $ 32 $ 12
2012
Gross
Direct $ 153 $ 55 $ 31 $ 9
Assumed Reinsurance 51 14 7 —
London Market 17 5 5 3
Total 221 74 43 12
Ceded (57)(26)(3) (2)
Net $ 164 $ 48 $ 40 $ 10
2011
Gross
Direct $ 170 $ 350 $ 32 $ 25
Assumed Reinsurance 55 12 8 —
London Market 23 16 6 4
Total 248 378 46 29
Ceded (59)(84)(6) (3)
Net $ 189 $ 294 $ 40 $ 26
[1] Excludes asbestos and environmental paid and incurred loss and LAE reported in Ongoing Operations. Total gross losses and LAE incurred in
Ongoing Operations for the years ended December 31, 2013, 2012 and 2011 includes $15, $13 and $30, respectively, related to asbestos and
environmental claims. Total gross losses and LAE paid in Ongoing Operations for the years ended December 31, 2013, 2012 and 2011 includes
$14, $15 and $22, respectively, related to asbestos and environmental claims.