The Hartford 2013 Annual Report Download - page 118
Download and view the complete annual report
Please find page 118 of the 2013 The Hartford annual report below. You can navigate through the pages in the report by either clicking on the pages listed below, or by using the keyword search tool below to find specific information within the annual report.-
 1
1 -
2
-
3
-
4
-
5
-
6
-
7
-
8
-
9
-
10
-
11
-
12
-
13
-
14
-
15
-
16
-
17
-
18
-
19
-
20
-
21
-
22
-
23
-
24
-
25
-
26
-
27
-
28
-
29
-
30
-
31
-
32
-
33
-
34
-
35
-
36
-
37
-
38
-
39
-
40
-
41
-
42
-
43
-
44
-
45
-
46
-
47
-
48
-
49
-
50
-
51
-
52
-
53
-
54
-
55
-
56
-
57
-
58
-
59
-
60
-
61
-
62
-
63
-
64
-
65
-
66
-
67
-
68
-
69
-
70
-
71
-
72
-
73
-
74
-
75
-
76
-
77
-
78
-
79
-
80
-
81
-
82
-
83
-
84
-
85
-
86
-
87
-
88
-
89
-
90
-
91
-
92
-
93
-
94
-
95
-
96
-
97
-
98
-
99
-
100
-
101
-
102
-
103
-
104
-
105
-
106
-
107
-
 108
108 -
 109
109 -
 110
110 -
 111
111 -
 112
112 -
 113
113 -
 114
114 -
 115
115 -
 116
116 -
 117
117 -
 118
118 -
 119
119 -
 120
120 -
 121
121 -
 122
122 -
 123
123 -
 124
124 -
 125
125 -
 126
126 -
 127
127 -
 128
128 -
129
-
130
-
131
-
132
-
133
-
134
-
135
-
136
-
137
-
138
-
139
-
140
-
141
-
142
-
143
-
144
-
145
-
146
-
147
-
148
-
149
-
150
-
151
-
152
-
153
-
154
-
155
-
156
-
157
-
158
-
159
-
160
-
161
-
162
-
163
-
164
-
165
-
166
-
167
-
168
-
169
-
170
-
171
-
172
-
173
-
174
-
175
-
176
-
177
-
178
-
179
-
180
-
181
-
182
-
183
-
184
-
185
-
186
-
187
-
188
-
189
-
190
-
191
-
192
-
193
-
194
-
195
-
196
-
197
-
198
-
199
-
200
-
201
-
202
-
203
-
204
-
205
-
206
-
207
-
208
-
209
-
210
-
211
-
212
-
213
-
214
-
215
-
216
-
217
-
218
-
219
-
220
-
221
-
222
-
223
-
224
-
225
-
226
-
227
-
228
-
229
-
230
-
231
-
232
-
233
-
234
-
235
-
236
-
237
-
238
-
239
-
240
-
241
-
242
-
243
-
244
-
245
-
246
-
247
-
248
-
249
-
250
 |
 |

118
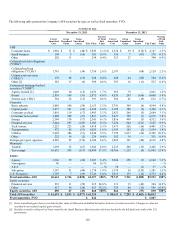
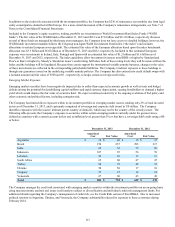
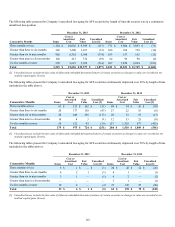
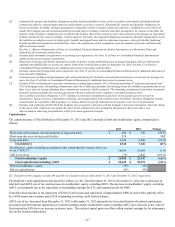
The following table presents the Company’s unrealized loss aging for AFS securities by length of time the security was in a continuous
unrealized loss position.
December 31, 2013 December 31, 2012
Consecutive Months Items
Cost or
Amortized
Cost Fair
Value Unrealized
Loss [1] Items
Cost or
Amortized
Cost Fair
Value Unrealized
Loss [1]
Three months or less 1,184 $ 10,056 $ 9,939 $ (117) 771 $ 3,964 $ 3,893 $ (71)
Greater than three to six months 349 1,200 1,167 (33) 306 764 730 (34)
Greater than six to nine months 956 6,362 5,988 (374) 183 157 142 (15)
Greater than nine to eleven months 148 413 374 (39) 64 96 90 (6)
Twelve months or more 578 5,625 5,109 (514) 687 7,850 6,894 (936)
Total 3,215 $ 23,656 $22,577 $ (1,077) 2,011 $ 12,831 $ 11,749 $ (1,062)
[1] Unrealized losses exclude the fair value of bifurcated embedded derivative features of certain securities as changes in value are recorded in net
realized capital gains (losses).
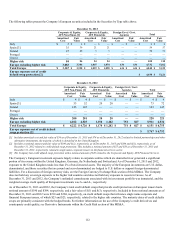
The following tables present the Company’s unrealized loss aging for AFS securities continuously depressed over 20% by length of time
(included in the table above).
December 31, 2013 December 31, 2012
Consecutive Months Items
Cost or
Amortized
Cost Fair
Value Unrealized
Loss [1] Items
Cost or
Amortized
Cost Fair
Value Unrealized
Loss [1]
Three months or less 63 $ 213 $ 162 $ (51) 68 $ 54 $ 36 $ (18)
Greater than three to six months 20 177 130 (47) 27 22 16 (6)
Greater than six to nine months 28 449 336 (113) 20 72 55 (17)
Greater than nine to eleven months 10 4 3 (1) 12 33 25 (8)
Twelve months or more 58 132 93 (39) 157 1,329 877 (452)
Total 179 $ 975 $ 724 $ (251) 284 $ 1,510 $ 1,009 $ (501)
[1] Unrealized losses exclude the fair value of bifurcated embedded derivatives features of certain securities as changes in value are recorded in net
realized capital gains (losses).
The following tables present the Company’s unrealized loss aging for AFS securities continuously depressed over 50% by length of time
(included in the tables above).
December 31, 2013 December 31, 2012
Consecutive Months Items
Cost or
Amortized
Cost Fair
Value Unrealized
Loss [1] Items
Cost or
Amortized
Cost Fair
Value Unrealized
Loss [1]
Three months or less 8 $ 1 $ — $ (1) 20 $ 48 $ 22 $ (26)
Greater than three to six months 4 2 1 (1) 4 1 — (1)
Greater than six to nine months 3 1 — (1) 4 2 — (2)
Greater than nine to eleven months — — — — 7 1 — (1)
Twelve months or more 18 2 — (2) 27 147 57 (90)
Total 33 $ 6 $ 1 $ (5) 62 $ 199 $ 79 $ (120)
[1] Unrealized losses exclude the fair value of bifurcate embedded derivatives features of certain securities as changes in value are recorded in net
realized capital gains (losses).