The Hartford 2013 Annual Report Download - page 230
Download and view the complete annual report
Please find page 230 of the 2013 The Hartford annual report below. You can navigate through the pages in the report by either clicking on the pages listed below, or by using the keyword search tool below to find specific information within the annual report.-
 1
1 -
2
-
3
-
4
-
5
-
6
-
7
-
8
-
9
-
10
-
11
-
12
-
13
-
14
-
15
-
16
-
17
-
18
-
19
-
20
-
21
-
22
-
23
-
24
-
25
-
26
-
27
-
28
-
29
-
30
-
31
-
32
-
33
-
34
-
35
-
36
-
37
-
38
-
39
-
40
-
41
-
42
-
43
-
44
-
45
-
46
-
47
-
48
-
49
-
50
-
51
-
52
-
53
-
54
-
55
-
56
-
57
-
58
-
59
-
60
-
61
-
62
-
63
-
64
-
65
-
66
-
67
-
68
-
69
-
70
-
71
-
72
-
73
-
74
-
75
-
76
-
77
-
78
-
79
-
80
-
81
-
82
-
83
-
84
-
85
-
86
-
87
-
88
-
89
-
90
-
91
-
92
-
93
-
94
-
95
-
96
-
97
-
98
-
99
-
100
-
101
-
102
-
103
-
104
-
105
-
106
-
107
-
108
-
109
-
110
-
111
-
112
-
113
-
114
-
115
-
116
-
117
-
118
-
119
-
120
-
121
-
122
-
123
-
124
-
125
-
126
-
127
-
128
-
129
-
130
-
131
-
132
-
133
-
134
-
135
-
136
-
137
-
138
-
139
-
140
-
141
-
142
-
143
-
144
-
145
-
146
-
147
-
148
-
149
-
150
-
151
-
152
-
153
-
154
-
155
-
156
-
157
-
158
-
159
-
160
-
161
-
162
-
163
-
164
-
165
-
166
-
167
-
168
-
169
-
170
-
171
-
172
-
173
-
174
-
175
-
176
-
177
-
178
-
179
-
180
-
181
-
182
-
183
-
184
-
185
-
186
-
187
-
188
-
189
-
190
-
191
-
192
-
193
-
194
-
195
-
196
-
197
-
198
-
199
-
200
-
201
-
202
-
203
-
204
-
205
-
206
-
207
-
208
-
209
-
210
-
211
-
212
-
213
-
214
-
215
-
216
-
217
-
218
-
219
-
 220
220 -
 221
221 -
 222
222 -
 223
223 -
 224
224 -
 225
225 -
 226
226 -
 227
227 -
 228
228 -
 229
229 -
 230
230 -
 231
231 -
 232
232 -
 233
233 -
 234
234 -
 235
235 -
 236
236 -
 237
237 -
 238
238 -
 239
239 -
 240
240 -
241
-
242
-
243
-
244
-
245
-
246
-
247
-
248
-
249
-
250
 |
 |

F-94
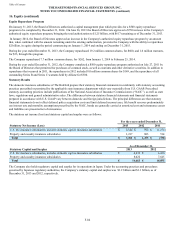
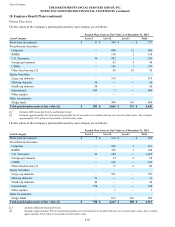
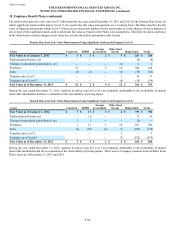
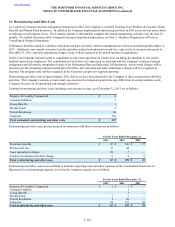
The tables below provide a fair value level 3 rollforward for the years ended December 31, 2013 and 2012 for the Pension Plan Assets for
which significant unobservable inputs (Level 3) are used in the fair value measurement on a recurring basis. The Plan classifies the fair
value of financial instruments within Level 3 if there are no observable markets for the instruments or, in the absence of active markets, if
one or more of the significant inputs used to determine fair value are based on the Plan’s own assumptions. Therefore, the gains and losses
in the tables below include changes in fair value due to both observable and unobservable factors.
Pension Plan Asset Fair Value Measurements Using Significant Unobservable Inputs (Level 3)
Assets Corporate RMBS Foreign
government Other fixed
income Hedge funds Totals
Fair Value as of January 1, 2013 $ 3 $ 3 $ 2 $ 9 $ 263 $ 280
Realized gains/(losses), net — — — — (6)(6)
Changes in unrealized gains/(losses), net — — — (1) 2 1
Purchases 12 — 2 10 200 224
Sales (3) (1) — (3)(79)(86)
Transfers into Level 3 — — — 1 36 37
Transfers out of Level 3 — — — (4)(55)(59)
Fair Value as of December 31, 2013 $ 12 $ 2 $ 4 $ 12 $ 361 $ 391
During the year ended December 31, 2013, transfers in and/or (out) of Level 3 are primarily attributable to the availability of market
observable information and the re-evaluation of the observability of pricing inputs.
Pension Plan Asset Fair Value Measurements Using Significant Unobservable Inputs (Level 3)
Assets Corporate RMBS Foreign
government Other fixed
income Hedge funds Totals
Fair Value as of January 1, 2012 $ 3 $ 11 $ 3 $ 4 $ 759 $ 780
Realized gains/(losses), net — (1) — — 17 16
Changes in unrealized gains/(losses), net 1 1 — — (2) —
Purchases 1 17 1 10 267 296
Sales (2) (25)(2)(1)(106)(136)
Transfers into Level 3 — — — 3 — 3
Transfers out of Level 3 — — — (7)(672)(679)
Fair Value as of December 31, 2012 $ 3 $ 3 $ 2 $ 9 $ 263 $ 280
During the year ended December 31, 2012, transfers in and/or (out) of Level 3 are primarily attributable to the availability of market
observable information and the re-evaluation of the observability of pricing inputs. There was no Company common stock included in the
Plan’s assets as of December 31, 2013 and 2012.
Table of Contents THE HARTFORD FINANCIAL SERVICES GROUP, INC.
NOTES TO CONSOLIDATED FINANCIAL STATEMENTS (continued)
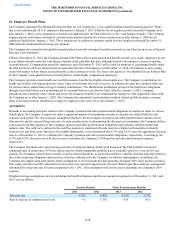
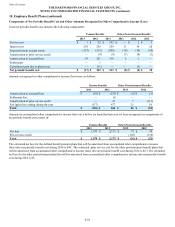
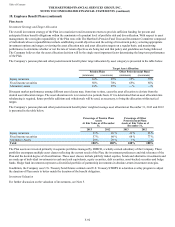
18. Employee Benefit Plans (continued)