The Hartford 2013 Annual Report Download - page 178
Download and view the complete annual report
Please find page 178 of the 2013 The Hartford annual report below. You can navigate through the pages in the report by either clicking on the pages listed below, or by using the keyword search tool below to find specific information within the annual report.-
 1
1 -
2
-
3
-
4
-
5
-
6
-
7
-
8
-
9
-
10
-
11
-
12
-
13
-
14
-
15
-
16
-
17
-
18
-
19
-
20
-
21
-
22
-
23
-
24
-
25
-
26
-
27
-
28
-
29
-
30
-
31
-
32
-
33
-
34
-
35
-
36
-
37
-
38
-
39
-
40
-
41
-
42
-
43
-
44
-
45
-
46
-
47
-
48
-
49
-
50
-
51
-
52
-
53
-
54
-
55
-
56
-
57
-
58
-
59
-
60
-
61
-
62
-
63
-
64
-
65
-
66
-
67
-
68
-
69
-
70
-
71
-
72
-
73
-
74
-
75
-
76
-
77
-
78
-
79
-
80
-
81
-
82
-
83
-
84
-
85
-
86
-
87
-
88
-
89
-
90
-
91
-
92
-
93
-
94
-
95
-
96
-
97
-
98
-
99
-
100
-
101
-
102
-
103
-
104
-
105
-
106
-
107
-
108
-
109
-
110
-
111
-
112
-
113
-
114
-
115
-
116
-
117
-
118
-
119
-
120
-
121
-
122
-
123
-
124
-
125
-
126
-
127
-
128
-
129
-
130
-
131
-
132
-
133
-
134
-
135
-
136
-
137
-
138
-
139
-
140
-
141
-
142
-
143
-
144
-
145
-
146
-
147
-
148
-
149
-
150
-
151
-
152
-
153
-
154
-
155
-
156
-
157
-
158
-
159
-
160
-
161
-
162
-
163
-
164
-
165
-
166
-
167
-
 168
168 -
 169
169 -
 170
170 -
 171
171 -
 172
172 -
 173
173 -
 174
174 -
 175
175 -
 176
176 -
 177
177 -
 178
178 -
 179
179 -
 180
180 -
 181
181 -
 182
182 -
 183
183 -
 184
184 -
 185
185 -
 186
186 -
 187
187 -
 188
188 -
189
-
190
-
191
-
192
-
193
-
194
-
195
-
196
-
197
-
198
-
199
-
200
-
201
-
202
-
203
-
204
-
205
-
206
-
207
-
208
-
209
-
210
-
211
-
212
-
213
-
214
-
215
-
216
-
217
-
218
-
219
-
220
-
221
-
222
-
223
-
224
-
225
-
226
-
227
-
228
-
229
-
230
-
231
-
232
-
233
-
234
-
235
-
236
-
237
-
238
-
239
-
240
-
241
-
242
-
243
-
244
-
245
-
246
-
247
-
248
-
249
-
250
 |
 |

F-42
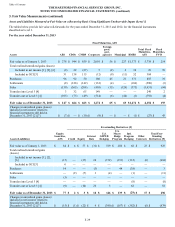
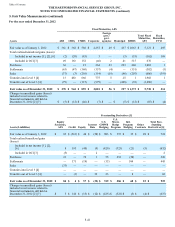
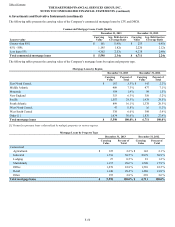
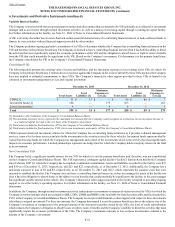
Assets
Limited Partnerships
and Other Alternative
Investments
Reinsurance
Recoverable
for U.S.
GMWB Separate Accounts
Fair value as of January 1, 2012 $ — $ 443 $ 1,031
Total realized/unrealized gains (losses)
Included in net income [1], [2], [6] (1)(280) 37
Included in OCI [3] — — —
Purchases 55 — 252
Settlements — 28 (1)
Sales — — (476)
Transfers into Level 3 [4] 260 — 443
Transfers out of Level 3 [4] — — (703)
Fair value as of December 31, 2012 $ 314 $ 191 $ 583
Changes in unrealized gains (losses) included in net income related to
financial instruments still held at December 31, 2012 [2] [7] $ (1) $ (280) $ 28
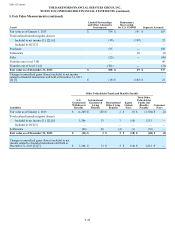
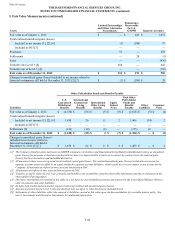
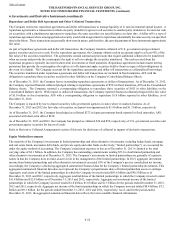
Other Policyholder Funds and Benefits Payable
Liabilities
U.S.
Guaranteed
Withdrawal
Benefits
International
Guaranteed
Living
Benefits
International
Other Living
Benefits
Equity
Linked
Notes
Total Other
Policyholder
Funds and
Benefits
Payable Other
Liabilities Consumer
Notes
Fair value as of January 1, 2012 $ (2,538) $ (66) $ (5) $ (9) $ (2,618) $ (9) $ (4)
Total realized/unrealized gains (losses)
Included in net income [1], [2], [6] 1,430 26 11 2 1,469 (34) 2
Included in OCI [3] — — — — — — —
Settlements [8] (141) (10)(4) — (155) 43 —
Fair value as of December 31, 2012 $ (1,249) $ (50) $ 2 $ (7) $ (1,304) $ — $ (2)
Changes in unrealized gains (losses)
included in net income related to
financial instruments still held at
December 31, 2012 [2] [7] $ 1,430 $ 26 $ 11 $ 2 $ 1,469 $ — $ 2
[1] The Company classifies gains and losses on GMWB reinsurance derivatives and Guaranteed Living Benefit embedded derivatives as unrealized
gains (losses) for purposes of disclosure in this table because it is impracticable to track on a contract-by-contract basis the realized gains
(losses) for these derivatives and embedded derivatives.
[2] All amounts in these rows are reported in net realized capital gains/losses. The realized/unrealized gains (losses) included in net income for
separate account assets are offset by an equal amount for separate account liabilities, which results in a net zero impact on net income for the
Company. All amounts are before income taxes and amortization DAC.
[3] All amounts are before income taxes and amortization of DAC.
[4] Transfers in and/or (out) of Level 3 are primarily attributable to the availability of market observable information and the re-evaluation of the
observability of pricing inputs.
[5] Derivative instruments are reported in this table on a net basis for asset/(liability) positions and reported in the Consolidated Balance Sheet in
other investments and other liabilities.
[6] Includes both market and non-market impacts in deriving realized and unrealized gains (losses).
[7] Amounts presented are for Level 3 only and therefore may not agree to other disclosures included herein.
[8] Settlements of other liabilities reflect the removal of liabilities carried at fair value upon the deconsolidation of a variable interest entity. See
note 6, Investments and Derivative Instruments for additional information.
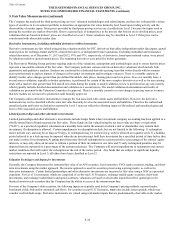
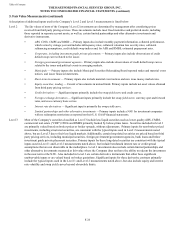
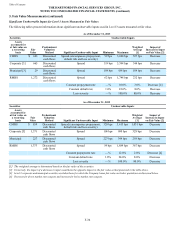
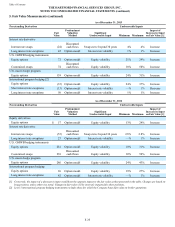
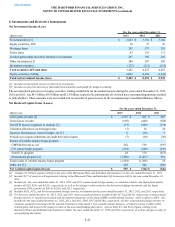
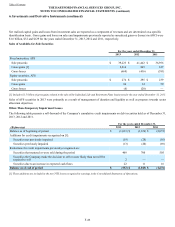
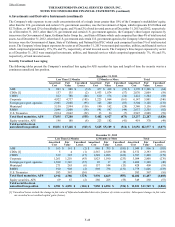
Table of Contents THE HARTFORD FINANCIAL SERVICES GROUP, INC.
NOTES TO CONSOLIDATED FINANCIAL STATEMENTS (continued)
5. Fair Value Measurements (continued)