The Hartford 2013 Annual Report Download - page 139
Download and view the complete annual report
Please find page 139 of the 2013 The Hartford annual report below. You can navigate through the pages in the report by either clicking on the pages listed below, or by using the keyword search tool below to find specific information within the annual report.-
 1
1 -
2
-
3
-
4
-
5
-
6
-
7
-
8
-
9
-
10
-
11
-
12
-
13
-
14
-
15
-
16
-
17
-
18
-
19
-
20
-
21
-
22
-
23
-
24
-
25
-
26
-
27
-
28
-
29
-
30
-
31
-
32
-
33
-
34
-
35
-
36
-
37
-
38
-
39
-
40
-
41
-
42
-
43
-
44
-
45
-
46
-
47
-
48
-
49
-
50
-
51
-
52
-
53
-
54
-
55
-
56
-
57
-
58
-
59
-
60
-
61
-
62
-
63
-
64
-
65
-
66
-
67
-
68
-
69
-
70
-
71
-
72
-
73
-
74
-
75
-
76
-
77
-
78
-
79
-
80
-
81
-
82
-
83
-
84
-
85
-
86
-
87
-
88
-
89
-
90
-
91
-
92
-
93
-
94
-
95
-
96
-
97
-
98
-
99
-
100
-
101
-
102
-
103
-
104
-
105
-
106
-
107
-
108
-
109
-
110
-
111
-
112
-
113
-
114
-
115
-
116
-
117
-
118
-
119
-
120
-
121
-
122
-
123
-
124
-
125
-
126
-
127
-
128
-
 129
129 -
 130
130 -
 131
131 -
 132
132 -
 133
133 -
 134
134 -
 135
135 -
 136
136 -
 137
137 -
 138
138 -
 139
139 -
 140
140 -
 141
141 -
 142
142 -
 143
143 -
 144
144 -
 145
145 -
 146
146 -
 147
147 -
 148
148 -
 149
149 -
150
-
151
-
152
-
153
-
154
-
155
-
156
-
157
-
158
-
159
-
160
-
161
-
162
-
163
-
164
-
165
-
166
-
167
-
168
-
169
-
170
-
171
-
172
-
173
-
174
-
175
-
176
-
177
-
178
-
179
-
180
-
181
-
182
-
183
-
184
-
185
-
186
-
187
-
188
-
189
-
190
-
191
-
192
-
193
-
194
-
195
-
196
-
197
-
198
-
199
-
200
-
201
-
202
-
203
-
204
-
205
-
206
-
207
-
208
-
209
-
210
-
211
-
212
-
213
-
214
-
215
-
216
-
217
-
218
-
219
-
220
-
221
-
222
-
223
-
224
-
225
-
226
-
227
-
228
-
229
-
230
-
231
-
232
-
233
-
234
-
235
-
236
-
237
-
238
-
239
-
240
-
241
-
242
-
243
-
244
-
245
-
246
-
247
-
248
-
249
-
250
 |
 |

F-3
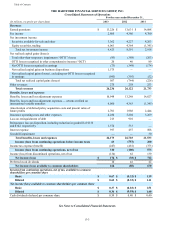
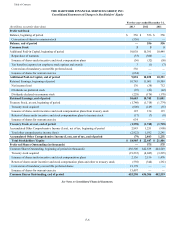
For the years ended December 31,
(In millions, except for per share data) 2013 2012 2011
Revenues
Earned premiums $ 13,226 $ 13,631 $ 14,088
Fee income 2,805 4,386 4,700
Net investment income:
Securities available-for-sale and other 3,362 4,227 4,263
Equity securities, trading 6,061 4,364 (1,345)
Total net investment income 9,423 8,591 2,918
Net realized capital gains (losses):
Total other-than-temporary impairment (“OTTI”) losses (93)(389)(263)
OTTI losses recognized in other comprehensive income (“OCI”) 20 40 89
Net OTTI losses recognized in earnings (73)(349)(174)
Net realized capital gains on business dispositions 1,575 — —
Net realized capital gains (losses), excluding net OTTI losses recognized
in earnings (995)(395)(52)
Total net realized capital gains (losses) 507 (744)(226)
Other revenues 275 258 253
Total revenues 26,236 26,122 21,733
Benefits, losses and expenses
Benefits, losses and loss adjustment expenses 10,948 13,248 14,627
Benefits, losses and loss adjustment expenses — returns credited on
international variable annuities 6,060 4,363 (1,345)
Amortization of deferred policy acquisition costs and present value of
future profits 2,701 1,988 2,444
Insurance operating costs and other expenses 4,280 5,204 5,269
Loss on extinguishment of debt 213 910 —
Reinsurance loss on disposition, including reduction in goodwill of $156
and $342, respectively 1,574 533 —
Interest expense 397 457 508
Goodwill impairment — — 30
Total benefits, losses and expenses 26,173 26,703 21,533
Income (loss) from continuing operations before income taxes 63 (581) 200
Income tax expense (benefit) (247)(481)(373)
Income (loss) from continuing operations, net of tax 310 (100) 573
Income (loss) from discontinued operations, net of tax (134) 62 139
Net income (loss) $ 176 $ (38) $ 712
Preferred stock dividends 10 42 42
Net income (loss) available to common shareholders 166 (80) 670
Income from continuing operations, net of tax, available to common
shareholders per common share
Basic $ 0.67 $ (0.32) $ 1.19
Diluted $ 0.62 $ (0.32) $ 1.11
Net income (loss) available to common shareholders per common share
Basic $ 0.37 $ (0.18) $ 1.51
Diluted $ 0.34 $ (0.18) $ 1.40
Cash dividends declared per common share $ 0.50 $ 0.40 $ 0.40
See Notes to Consolidated Financial Statements.
Table of Contents
THE HARTFORD FINANCIAL SERVICES GROUP, INC.
Consolidated Statements of Operations