The Hartford 2013 Annual Report Download - page 53
Download and view the complete annual report
Please find page 53 of the 2013 The Hartford annual report below. You can navigate through the pages in the report by either clicking on the pages listed below, or by using the keyword search tool below to find specific information within the annual report.-
 1
1 -
2
-
3
-
4
-
5
-
6
-
7
-
8
-
9
-
10
-
11
-
12
-
13
-
14
-
15
-
16
-
17
-
18
-
19
-
20
-
21
-
22
-
23
-
24
-
25
-
26
-
27
-
28
-
29
-
30
-
31
-
32
-
33
-
34
-
35
-
36
-
37
-
38
-
39
-
40
-
41
-
42
-
 43
43 -
 44
44 -
 45
45 -
 46
46 -
 47
47 -
 48
48 -
 49
49 -
 50
50 -
 51
51 -
 52
52 -
 53
53 -
 54
54 -
 55
55 -
 56
56 -
 57
57 -
 58
58 -
 59
59 -
 60
60 -
 61
61 -
 62
62 -
 63
63 -
64
-
65
-
66
-
67
-
68
-
69
-
70
-
71
-
72
-
73
-
74
-
75
-
76
-
77
-
78
-
79
-
80
-
81
-
82
-
83
-
84
-
85
-
86
-
87
-
88
-
89
-
90
-
91
-
92
-
93
-
94
-
95
-
96
-
97
-
98
-
99
-
100
-
101
-
102
-
103
-
104
-
105
-
106
-
107
-
108
-
109
-
110
-
111
-
112
-
113
-
114
-
115
-
116
-
117
-
118
-
119
-
120
-
121
-
122
-
123
-
124
-
125
-
126
-
127
-
128
-
129
-
130
-
131
-
132
-
133
-
134
-
135
-
136
-
137
-
138
-
139
-
140
-
141
-
142
-
143
-
144
-
145
-
146
-
147
-
148
-
149
-
150
-
151
-
152
-
153
-
154
-
155
-
156
-
157
-
158
-
159
-
160
-
161
-
162
-
163
-
164
-
165
-
166
-
167
-
168
-
169
-
170
-
171
-
172
-
173
-
174
-
175
-
176
-
177
-
178
-
179
-
180
-
181
-
182
-
183
-
184
-
185
-
186
-
187
-
188
-
189
-
190
-
191
-
192
-
193
-
194
-
195
-
196
-
197
-
198
-
199
-
200
-
201
-
202
-
203
-
204
-
205
-
206
-
207
-
208
-
209
-
210
-
211
-
212
-
213
-
214
-
215
-
216
-
217
-
218
-
219
-
220
-
221
-
222
-
223
-
224
-
225
-
226
-
227
-
228
-
229
-
230
-
231
-
232
-
233
-
234
-
235
-
236
-
237
-
238
-
239
-
240
-
241
-
242
-
243
-
244
-
245
-
246
-
247
-
248
-
249
-
250
 |
 |

53
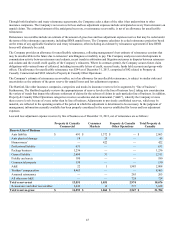
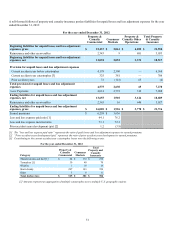
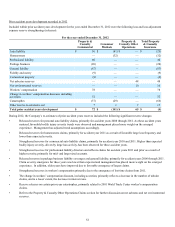
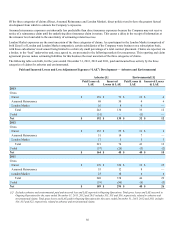
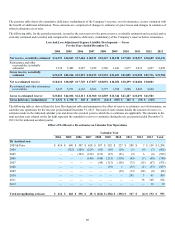
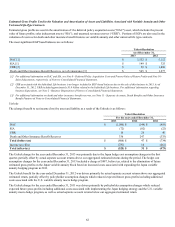
A roll-forward follows of property and casualty insurance product liabilities for unpaid losses and loss adjustment expenses for the year
ended December 31, 2011:
For the year ended December 31, 2011
Property &
Casualty
Commercial Consumer
Markets
Property &
Casualty Other
Operations
Total Property
& Casualty
Insurance
Beginning liabilities for unpaid losses and loss adjustment
expenses, gross $ 14,727 $ 2,177 $ 4,121 $ 21,025
Reinsurance and other recoverables 2,361 17 699 3,077
Beginning liabilities for unpaid losses and loss adjustment
expenses, net 12,366 2,160 3,422 17,948
Provision for unpaid losses and loss adjustment expenses
Current accident year before catastrophes 4,139 2,536 — 6,675
Current accident year catastrophes [3] 320 425 — 745
Prior accident years 125 (75) 317 367
Total provision for unpaid losses and loss adjustment
expenses 4,584 2,886 317 7,787
Less: Payments 3,856 2,994 368 7,218
Ending liabilities for unpaid losses and loss adjustment
expenses, net 13,094 2,052 3,371 18,517
Reinsurance and other recoverables 2,343 9 681 3,033
Ending liabilities for unpaid losses and loss adjustment
expenses, gross $ 15,437 $ 2,061 $ 4,052 $ 21,550
Earned premiums $ 6,127 $ 3,747
Loss and loss expense paid ratio [1] 62.9 79.9
Loss and loss expense incurred ratio 74.8 77.0
Prior accident years development (pts) [2] 2.0 (2.0)
[1] The “loss and loss expense paid ratio” represents the ratio of paid losses and loss adjustment expenses to earned premiums.
[2] “Prior accident years development (pts)” represents the ratio of prior accident years development to earned premiums.
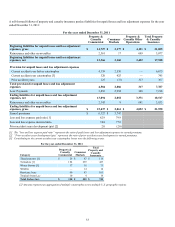
[3] Contributing to the current accident year catastrophes losses were the following events:
For the year ended December 31, 2011
Category
Property &
Casualty
Commercial Consumer
Markets
Total
Property and
Casualty
Insurance
Thunderstorms [1] $ 29 $ 87 $ 116
Tornadoes [1] 184 239 423
Winter Storms [1] 37 38 75
Wildfire — 14 14
Hurricane Irene 60 43 103
Tropical Storm Lee 10 4 14
Total (before tax) $ 320 $ 425 $ 745
[1] Amounts represent an aggregation of multiple catastrophes across multiple U.S. geographic regions.