The Hartford 2013 Annual Report Download - page 185
Download and view the complete annual report
Please find page 185 of the 2013 The Hartford annual report below. You can navigate through the pages in the report by either clicking on the pages listed below, or by using the keyword search tool below to find specific information within the annual report.-
 1
1 -
2
-
3
-
4
-
5
-
6
-
7
-
8
-
9
-
10
-
11
-
12
-
13
-
14
-
15
-
16
-
17
-
18
-
19
-
20
-
21
-
22
-
23
-
24
-
25
-
26
-
27
-
28
-
29
-
30
-
31
-
32
-
33
-
34
-
35
-
36
-
37
-
38
-
39
-
40
-
41
-
42
-
43
-
44
-
45
-
46
-
47
-
48
-
49
-
50
-
51
-
52
-
53
-
54
-
55
-
56
-
57
-
58
-
59
-
60
-
61
-
62
-
63
-
64
-
65
-
66
-
67
-
68
-
69
-
70
-
71
-
72
-
73
-
74
-
75
-
76
-
77
-
78
-
79
-
80
-
81
-
82
-
83
-
84
-
85
-
86
-
87
-
88
-
89
-
90
-
91
-
92
-
93
-
94
-
95
-
96
-
97
-
98
-
99
-
100
-
101
-
102
-
103
-
104
-
105
-
106
-
107
-
108
-
109
-
110
-
111
-
112
-
113
-
114
-
115
-
116
-
117
-
118
-
119
-
120
-
121
-
122
-
123
-
124
-
125
-
126
-
127
-
128
-
129
-
130
-
131
-
132
-
133
-
134
-
135
-
136
-
137
-
138
-
139
-
140
-
141
-
142
-
143
-
144
-
145
-
146
-
147
-
148
-
149
-
150
-
151
-
152
-
153
-
154
-
155
-
156
-
157
-
158
-
159
-
160
-
161
-
162
-
163
-
164
-
165
-
166
-
167
-
168
-
169
-
170
-
171
-
172
-
173
-
174
-
 175
175 -
 176
176 -
 177
177 -
 178
178 -
 179
179 -
 180
180 -
 181
181 -
 182
182 -
 183
183 -
 184
184 -
 185
185 -
 186
186 -
 187
187 -
 188
188 -
 189
189 -
 190
190 -
 191
191 -
 192
192 -
 193
193 -
 194
194 -
 195
195 -
196
-
197
-
198
-
199
-
200
-
201
-
202
-
203
-
204
-
205
-
206
-
207
-
208
-
209
-
210
-
211
-
212
-
213
-
214
-
215
-
216
-
217
-
218
-
219
-
220
-
221
-
222
-
223
-
224
-
225
-
226
-
227
-
228
-
229
-
230
-
231
-
232
-
233
-
234
-
235
-
236
-
237
-
238
-
239
-
240
-
241
-
242
-
243
-
244
-
245
-
246
-
247
-
248
-
249
-
250
 |
 |

F-49
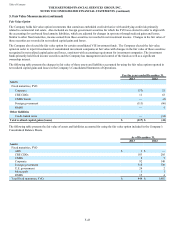
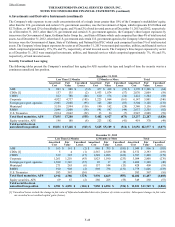
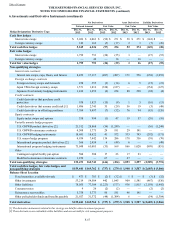
As of December 31, 2013, AFS securities in an unrealized loss position, consisted of 3,215 securities, primarily related to municipal
securities, foreign government and government agencies, and corporate securities, which are depressed primarily due to an increase in
interest rates since the securities were purchased and/or declines in the value of the currency in which the assets are denominated. As of
December 31, 2013, 94% of these securities were depressed less than 20% of cost or amortized cost. The increase in unrealized losses
during 2013 was primarily attributable to an increase in interest rates, partially offset by tighter credit spreads.
Most of the securities depressed for twelve months or more relate to certain floating rate corporate securities with greater than 10 years to
maturity concentrated in the financial services sector, foreign government and government agencies, as well as structured securities with
exposure to commercial and residential real estate. Although credit spreads have tightened during 2013, current market spreads continue
to be wider than spreads at the securities' respective purchase dates for structured securities with exposure to commercial and residential
real estate largely due to the economic and market uncertainties regarding future performance of certain commercial and residential real
estate backed securities. The majority of these securities have a floating-rate coupon referenced to a market index that has declined
substantially. In addition, equity securities include investment grade perpetual preferred securities that contain “debt-like” characteristics
where the decline in fair value is not attributable to issuer-specific credit deterioration, none of which have, nor are expected to, miss a
periodic dividend payment. These securities have been depressed due to the securities’ floating-rate coupon in the current low interest rate
environment, general market credit spread widening since the date of purchase and the long-dated nature of the securities. The Company
neither has an intention to sell nor does it expect to be required to sell the securities outlined above.
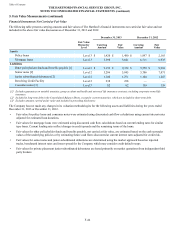
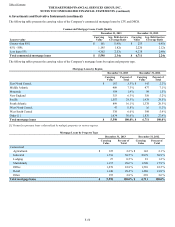
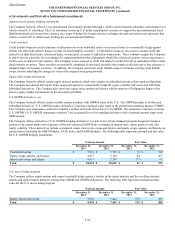
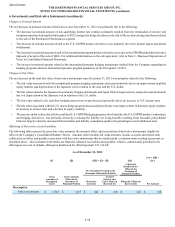
Mortgage Loans
December 31, 2013 December 31, 2012
Amortized
Cost [1] Valuation
Allowance Carrying
Value Amortized
Cost [1] Valuation
Allowance Carrying
Value
Total commercial mortgage loans [2] $ 5,665 $ (67) $ 5,598 $ 6,779 $ (68) $ 6,711
[1] Amortized cost represents carrying value prior to valuation allowances, if any.
[2] As of December 31, 2012, includes commercial mortgage loans relating to the sales of the Retirement Plans and Individual Life businesses; see
Note 2 - Business Dispositions of the Notes to Consolidated Financial Statements for further discussion of these transactions.
As of December 31, 2013 and 2012, the carrying value of mortgage loans associated with the valuation allowance was $191 and $291,
respectively. Included in the table above are mortgage loans held-for-sale with a carrying value and valuation allowance of $61 and $3,
respectively, as of December 31, 2013, and $47 and $3, respectively, as of December 31, 2012. The carrying value of these loans is included
in mortgage loans in the Company’s Consolidated Balance Sheets. As of December 31, 2013, loans within the Company’s mortgage loan
portfolio that have had extensions or restructurings other than what is allowable under the original terms of the contract are immaterial.
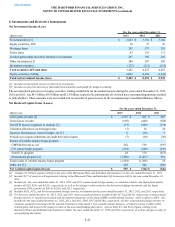
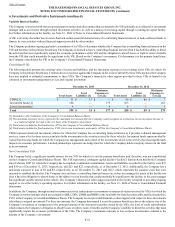
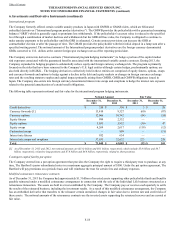
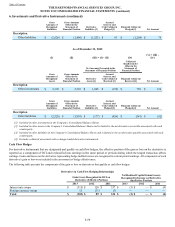
The following table presents the activity within the Company’s valuation allowance for mortgage loans. These loans have been evaluated
both individually and collectively for impairment. Loans evaluated collectively for impairment are immaterial.
For the years ended December 31,
2013 2012 2011
Balance as of January 1 $ (68) $ (102) $ (155)
(Additions)/Reversals (2) 14 (26)
Deductions 3 20 79
Balance as of December 31 $ (67) $ (68) $ (102)
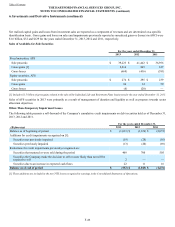
The weighted-average LTV ratio of the Company’s commercial mortgage loan portfolio was 59% as of December 31, 2013, while the
weighted-average LTV ratio at origination of these loans was 63%. LTV ratios compare the loan amount to the value of the underlying
property collateralizing the loan. The loan values are updated no less than annually through property level reviews of the portfolio. Factors
considered in the property valuation include, but are not limited to, actual and expected property cash flows, geographic market data and
capitalization rates. DSCRs compare a property’s net operating income to the borrower’s principal and interest payments. The weighted
average DSCR of the Company’s commercial mortgage loan portfolio was 2.34x as of December 31, 2013. As of December 31, 2013, the
Company held only one delinquent commercial mortgage loan past due by 90 days or more. The carrying value and valuation allowance
of this loan totaled $0 and $50, respectively, and was not accruing income. As of December 31, 2012, the Company held two delinquent
commercial mortgage loans past due by 90 days or more. These loans had a total carrying value and valuation allowance totaled $32 and $50,
respectively, and were not accruing income.
Table of Contents THE HARTFORD FINANCIAL SERVICES GROUP, INC.
NOTES TO CONSOLIDATED FINANCIAL STATEMENTS (continued)
6. Investments and Derivative Instruments (continued)