The Hartford 2013 Annual Report Download - page 55
Download and view the complete annual report
Please find page 55 of the 2013 The Hartford annual report below. You can navigate through the pages in the report by either clicking on the pages listed below, or by using the keyword search tool below to find specific information within the annual report.-
 1
1 -
2
-
3
-
4
-
5
-
6
-
7
-
8
-
9
-
10
-
11
-
12
-
13
-
14
-
15
-
16
-
17
-
18
-
19
-
20
-
21
-
22
-
23
-
24
-
25
-
26
-
27
-
28
-
29
-
30
-
31
-
32
-
33
-
34
-
35
-
36
-
37
-
38
-
39
-
40
-
41
-
42
-
43
-
44
-
 45
45 -
 46
46 -
 47
47 -
 48
48 -
 49
49 -
 50
50 -
 51
51 -
 52
52 -
 53
53 -
 54
54 -
 55
55 -
 56
56 -
 57
57 -
 58
58 -
 59
59 -
 60
60 -
 61
61 -
 62
62 -
 63
63 -
 64
64 -
 65
65 -
66
-
67
-
68
-
69
-
70
-
71
-
72
-
73
-
74
-
75
-
76
-
77
-
78
-
79
-
80
-
81
-
82
-
83
-
84
-
85
-
86
-
87
-
88
-
89
-
90
-
91
-
92
-
93
-
94
-
95
-
96
-
97
-
98
-
99
-
100
-
101
-
102
-
103
-
104
-
105
-
106
-
107
-
108
-
109
-
110
-
111
-
112
-
113
-
114
-
115
-
116
-
117
-
118
-
119
-
120
-
121
-
122
-
123
-
124
-
125
-
126
-
127
-
128
-
129
-
130
-
131
-
132
-
133
-
134
-
135
-
136
-
137
-
138
-
139
-
140
-
141
-
142
-
143
-
144
-
145
-
146
-
147
-
148
-
149
-
150
-
151
-
152
-
153
-
154
-
155
-
156
-
157
-
158
-
159
-
160
-
161
-
162
-
163
-
164
-
165
-
166
-
167
-
168
-
169
-
170
-
171
-
172
-
173
-
174
-
175
-
176
-
177
-
178
-
179
-
180
-
181
-
182
-
183
-
184
-
185
-
186
-
187
-
188
-
189
-
190
-
191
-
192
-
193
-
194
-
195
-
196
-
197
-
198
-
199
-
200
-
201
-
202
-
203
-
204
-
205
-
206
-
207
-
208
-
209
-
210
-
211
-
212
-
213
-
214
-
215
-
216
-
217
-
218
-
219
-
220
-
221
-
222
-
223
-
224
-
225
-
226
-
227
-
228
-
229
-
230
-
231
-
232
-
233
-
234
-
235
-
236
-
237
-
238
-
239
-
240
-
241
-
242
-
243
-
244
-
245
-
246
-
247
-
248
-
249
-
250
 |
 |

55
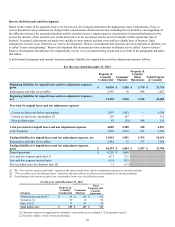
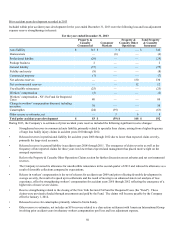
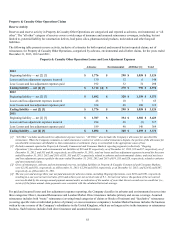
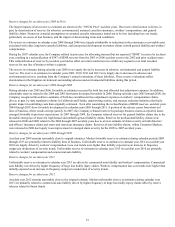
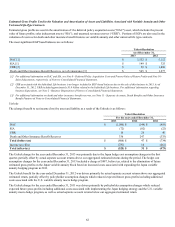
Property & Casualty Other Operations Claims
Reserve Activity
Reserves and reserve activity in Property & Casualty Other Operations are categorized and reported as asbestos, environmental, or “all
other”. The “all other” category of reserves covers a wide range of insurance and assumed reinsurance coverages, including, but not
limited to, potential liability for construction defects, lead paint, silica, pharmaceutical products, molestation and other long-tail
liabilities.
The following table presents reserve activity, inclusive of estimates for both reported and incurred but not reported claims, net of
reinsurance, for Property & Casualty Other Operations, categorized by asbestos, environmental and all other claims, for the years ended
December 31, 2013, 2012 and 2011.
Property & Casualty Other Operations Losses and Loss Adjustment Expenses
Asbestos Environmental All Other [1] Total
2013
Beginning liability — net [2] [3] $ 1,776 $ 290 $ 1,058 $ 3,124
Losses and loss adjustment expenses incurred 130 12 6 148
Less: Losses and loss adjustment expenses paid 192 32 74 298
Ending liability — net [2] [3] $ 1,714 [4] $ 270 $ 990 $ 2,974
2012
Beginning liability — net [2] [3] $ 1,892 $ 320 $ 1,159 $ 3,371
Losses and loss adjustment expenses incurred 48 10 7 65
Less: Losses and loss adjustment expenses paid 164 40 108 312
Ending liability — net [2] [3] $ 1,776 $ 290 $ 1,058 $ 3,124
2011
Beginning liability — net [2] [3] $ 1,787 $ 334 $ 1,302 $ 3,423
Losses and loss adjustment expenses incurred 294 26 (3) 317
Less: Losses and loss adjustment expenses paid 189 40 140 369
Ending liability — net [2] [3] $ 1,892 $ 320 $ 1,159 $ 3,371
[1] “All Other” includes unallocated loss adjustment expense reserves. “All Other” also includes the Company’s allowance for uncollectible
reinsurance. When the Company commutes a ceded reinsurance contract or settles a ceded reinsurance dispute, the portion of the allowance for
uncollectible reinsurance attributable to that commutation or settlement, if any, is reclassified to the appropriate cause of loss.
[2] Excludes amounts reported in Property & Casualty Commercial and Consumer Markets reporting segments (collectively “Ongoing
Operations”) for asbestos and environmental net liabilities of $18 and $5 respectively, as of December 31, 2013, $15 and $7, respectively, as of
December 31, 2012, and $15 and $8, respectively, as of December 31, 2011; total net losses and loss adjustment expenses incurred for the years
ended December 31, 2013, 2012 and 2011 of $15, $13 and $27, respectively, related to asbestos and environmental claims; and total net losses
and loss adjustment expenses paid for the years ended December 31, 2013, 2012 and 2011 of $14, $15 and $20, respectively, related to asbestos
and environmental claims.
[3] Gross of reinsurance, asbestos and environmental reserves, including liabilities in Property & Casualty Commercial and Consumer Markets,
were $2,182 and $311, respectively, as of December 31, 2013; $2,294 and $334, respectively, as of December 31, 2012; and $2,442 and $367,
respectively, as of December 31, 2011.
[4] The one year and average three year net paid amounts for asbestos claims, including Ongoing Operations, were $201 and $191, respectively,
resulting in a one year net survival ratio of 8.6 and a three year net survival ratio of 9.1. Net survival ratio is the quotient of the net carried
reserves divided by the average annual payment amount and is an indication of the number of years that the net carried reserve would last (i.e.,
survive) if the future annual claim payments were consistent with the calculated historical average.
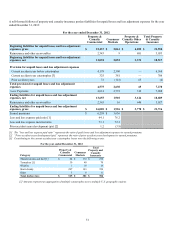
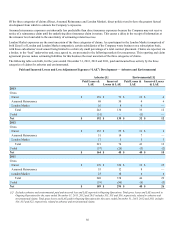
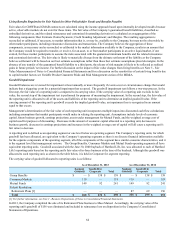
For paid and incurred losses and loss adjustment expenses reporting, the Company classifies its asbestos and environmental reserves into
three categories: Direct, Assumed Reinsurance and London Market. Direct insurance includes primary and excess coverage. Assumed
reinsurance includes both “treaty” reinsurance (covering broad categories of claims or blocks of business) and “facultative” reinsurance
(covering specific risks or individual policies of primary or excess insurance companies). London Market business includes the business
written by one or more of the Company’s subsidiaries in the United Kingdom, which are no longer active in the insurance or reinsurance
business. Such business includes both direct insurance and assumed reinsurance.