The Hartford 2013 Annual Report Download - page 172
Download and view the complete annual report
Please find page 172 of the 2013 The Hartford annual report below. You can navigate through the pages in the report by either clicking on the pages listed below, or by using the keyword search tool below to find specific information within the annual report.-
 1
1 -
2
-
3
-
4
-
5
-
6
-
7
-
8
-
9
-
10
-
11
-
12
-
13
-
14
-
15
-
16
-
17
-
18
-
19
-
20
-
21
-
22
-
23
-
24
-
25
-
26
-
27
-
28
-
29
-
30
-
31
-
32
-
33
-
34
-
35
-
36
-
37
-
38
-
39
-
40
-
41
-
42
-
43
-
44
-
45
-
46
-
47
-
48
-
49
-
50
-
51
-
52
-
53
-
54
-
55
-
56
-
57
-
58
-
59
-
60
-
61
-
62
-
63
-
64
-
65
-
66
-
67
-
68
-
69
-
70
-
71
-
72
-
73
-
74
-
75
-
76
-
77
-
78
-
79
-
80
-
81
-
82
-
83
-
84
-
85
-
86
-
87
-
88
-
89
-
90
-
91
-
92
-
93
-
94
-
95
-
96
-
97
-
98
-
99
-
100
-
101
-
102
-
103
-
104
-
105
-
106
-
107
-
108
-
109
-
110
-
111
-
112
-
113
-
114
-
115
-
116
-
117
-
118
-
119
-
120
-
121
-
122
-
123
-
124
-
125
-
126
-
127
-
128
-
129
-
130
-
131
-
132
-
133
-
134
-
135
-
136
-
137
-
138
-
139
-
140
-
141
-
142
-
143
-
144
-
145
-
146
-
147
-
148
-
149
-
150
-
151
-
152
-
153
-
154
-
155
-
156
-
157
-
158
-
159
-
160
-
161
-
 162
162 -
 163
163 -
 164
164 -
 165
165 -
 166
166 -
 167
167 -
 168
168 -
 169
169 -
 170
170 -
 171
171 -
 172
172 -
 173
173 -
 174
174 -
 175
175 -
 176
176 -
 177
177 -
 178
178 -
 179
179 -
 180
180 -
 181
181 -
 182
182 -
183
-
184
-
185
-
186
-
187
-
188
-
189
-
190
-
191
-
192
-
193
-
194
-
195
-
196
-
197
-
198
-
199
-
200
-
201
-
202
-
203
-
204
-
205
-
206
-
207
-
208
-
209
-
210
-
211
-
212
-
213
-
214
-
215
-
216
-
217
-
218
-
219
-
220
-
221
-
222
-
223
-
224
-
225
-
226
-
227
-
228
-
229
-
230
-
231
-
232
-
233
-
234
-
235
-
236
-
237
-
238
-
239
-
240
-
241
-
242
-
243
-
244
-
245
-
246
-
247
-
248
-
249
-
250
 |
 |
F-36
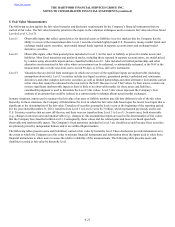
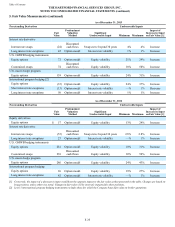
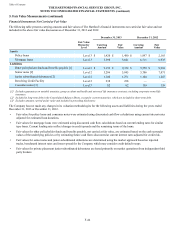
Securities and derivatives for which the Company bases fair value on broker quotations predominately include ABS, CDOs, corporate,
fixed maturities, FVO and certain credit derivatives. Due to the lack of transparency in the process brokers use to develop prices for
these investments, the Company does not have access to the significant unobservable inputs brokers use to price these securities and
derivatives. The Company believes however, the types of inputs brokers may use would likely be similar to those used to price securities
and derivatives for which inputs are available to the Company, and therefore may include, but not be limited to, loss severity rates,
constant prepayment rates, constant default rates and credit spreads. Therefore, similar to non broker priced securities and derivatives,
generally, increases in these inputs would cause fair values to decrease. For the year ended December 31, 2013, no significant
adjustments were made by the Company to broker prices received.
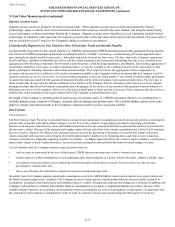
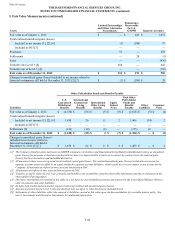
As of December 31, 2013 and 2012, excluded from the tables above are limited partnerships and other alternative investments which
total $108 and $314, respectively, of Level 3 assets measured at fair value. The predominant valuation method uses a NAV calculated on
a monthly basis and represents funds where the Company does not have the ability to redeem the investment in the near-term at that
NAV, including an assessment of the investee's liquidity.
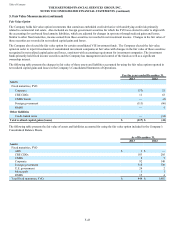
Product Derivatives
The Company formerly offered certain variable annuity products with GMWB riders in the U.S., and Japan.The GMWB provides the
policyholder with a guaranteed remaining balance (“GRB”) which is generally equal to premiums less withdrawals. If the
policyholder’s account value is reduced to the specified level through a combination of market declines and withdrawals but the GRB
still has value, the Company is obligated to continue to make annuity payments to the policyholder until the GRB is exhausted. Certain
contract provisions can increase the GRB at contractholder election or after the passage of time. The GMWB represents an embedded
derivative in the variable annuity contract. When it is determined that (1) the embedded derivative possesses economic characteristics
that are not clearly and closely related to the economic characteristics of the host contract, and (2) a separate instrument with the same
terms would qualify as a derivative instrument, the embedded derivative is bifurcated from the host for measurement purposes. The
embedded derivative is carried at fair value, with changes in fair value reported in net realized capital gains and losses. The Company’s
GMWB liability is reported in other policyholder funds and benefits payable in the Consolidated Balance Sheets. The notional value of
the embedded derivative is the GRB.
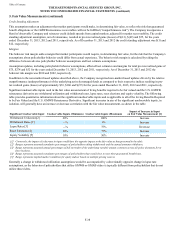
In valuing the embedded derivative, the Company attributes to the derivative a portion of the expected fees to be collected over the
expected life of the contract from the contract holder equal to the present value of future GMWB claims (the “Attributed Fees”). The
excess of fees collected from the contract holder in the current period over the current period’s Attributed Fees are associated with the
host variable annuity contract and reported in fee income.
U.S. GMWB Reinsurance Derivative
The Company has reinsurance arrangements in place to transfer a portion of its risk of loss due to GMWB. These arrangements are
recognized as derivatives and carried at fair value in reinsurance recoverables. Changes in the fair value of the reinsurance agreements
are reported in net realized capital gains and losses.
The fair value of the U.S. GMWB reinsurance derivative is calculated as an aggregation of the components described in the Living
Benefits Required to be Fair Valued discussion below and is modeled using significant unobservable policyholder behavior inputs,
identical to those used in calculating the underlying liability, such as lapses, fund selection, resets and withdrawal utilization and risk
margins.
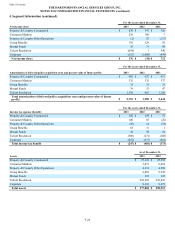
Table of Contents THE HARTFORD FINANCIAL SERVICES GROUP, INC.
NOTES TO CONSOLIDATED FINANCIAL STATEMENTS (continued)
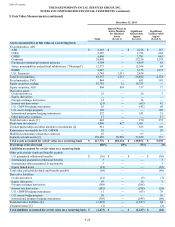
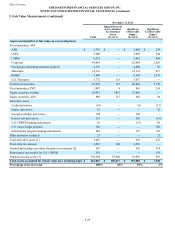
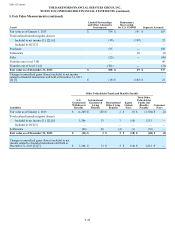
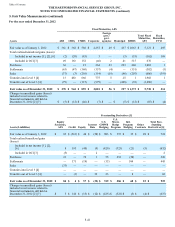
5. Fair Value Measurements (continued)