The Hartford 2013 Annual Report Download - page 175
Download and view the complete annual report
Please find page 175 of the 2013 The Hartford annual report below. You can navigate through the pages in the report by either clicking on the pages listed below, or by using the keyword search tool below to find specific information within the annual report.-
 1
1 -
2
-
3
-
4
-
5
-
6
-
7
-
8
-
9
-
10
-
11
-
12
-
13
-
14
-
15
-
16
-
17
-
18
-
19
-
20
-
21
-
22
-
23
-
24
-
25
-
26
-
27
-
28
-
29
-
30
-
31
-
32
-
33
-
34
-
35
-
36
-
37
-
38
-
39
-
40
-
41
-
42
-
43
-
44
-
45
-
46
-
47
-
48
-
49
-
50
-
51
-
52
-
53
-
54
-
55
-
56
-
57
-
58
-
59
-
60
-
61
-
62
-
63
-
64
-
65
-
66
-
67
-
68
-
69
-
70
-
71
-
72
-
73
-
74
-
75
-
76
-
77
-
78
-
79
-
80
-
81
-
82
-
83
-
84
-
85
-
86
-
87
-
88
-
89
-
90
-
91
-
92
-
93
-
94
-
95
-
96
-
97
-
98
-
99
-
100
-
101
-
102
-
103
-
104
-
105
-
106
-
107
-
108
-
109
-
110
-
111
-
112
-
113
-
114
-
115
-
116
-
117
-
118
-
119
-
120
-
121
-
122
-
123
-
124
-
125
-
126
-
127
-
128
-
129
-
130
-
131
-
132
-
133
-
134
-
135
-
136
-
137
-
138
-
139
-
140
-
141
-
142
-
143
-
144
-
145
-
146
-
147
-
148
-
149
-
150
-
151
-
152
-
153
-
154
-
155
-
156
-
157
-
158
-
159
-
160
-
161
-
162
-
163
-
164
-
 165
165 -
 166
166 -
 167
167 -
 168
168 -
 169
169 -
 170
170 -
 171
171 -
 172
172 -
 173
173 -
 174
174 -
 175
175 -
 176
176 -
 177
177 -
 178
178 -
 179
179 -
 180
180 -
 181
181 -
 182
182 -
 183
183 -
 184
184 -
 185
185 -
186
-
187
-
188
-
189
-
190
-
191
-
192
-
193
-
194
-
195
-
196
-
197
-
198
-
199
-
200
-
201
-
202
-
203
-
204
-
205
-
206
-
207
-
208
-
209
-
210
-
211
-
212
-
213
-
214
-
215
-
216
-
217
-
218
-
219
-
220
-
221
-
222
-
223
-
224
-
225
-
226
-
227
-
228
-
229
-
230
-
231
-
232
-
233
-
234
-
235
-
236
-
237
-
238
-
239
-
240
-
241
-
242
-
243
-
244
-
245
-
246
-
247
-
248
-
249
-
250
 |
 |

F-39
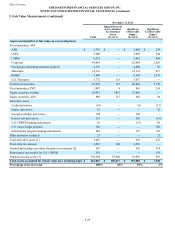
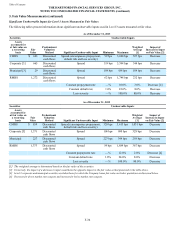
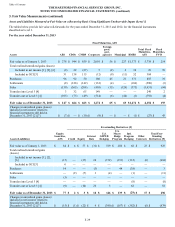
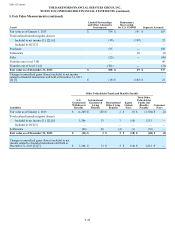
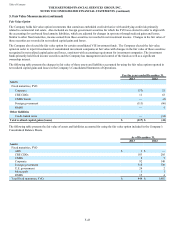
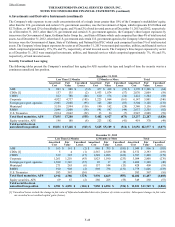
Assets and Liabilities Measured at Fair Value on a Recurring Basis Using Significant Unobservable Inputs (Level 3)
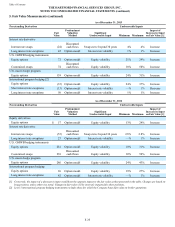
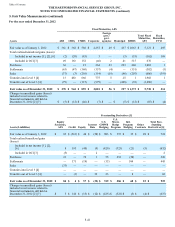
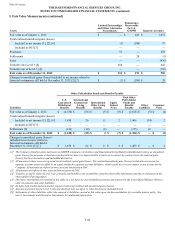
The tables below provide fair value roll-forwards for the years ended December 31, 2013 and 2012, for the financial instruments
classified as Level 3.
For the year ended December 31, 2013
Fixed Maturities, AFS
Assets ABS CDOs CMBS Corporate
Foreign
govt./
govt.
agencies Municipal RMBS
Total Fixed
Maturities,
AFS
Fixed
Maturities,
FVO
Fair value as of January 1, 2013 $ 278 $ 944 $ 859 $ 2,001 $ 56 $ 227 $1,373 $ 5,738 $ 214
Total realized/unrealized gains (losses)
Included in net income [1], [2], [6] (9) 22 (27) 5 (2) 2 38 29 59
Included in OCI [3] 31 138 115 (12)(9)(11) 52 304 —
Purchases 96 92 50 180 45 21 371 855 19
Settlements (8) (126) (142)(132)(4) — (186)(598) (3)
Sales (139) (365) (208)(403)(15)(126)(375)(1,631) (94)
Transfers into Level 3 [4] 3 32 65 149 — — — 249 2
Transfers out of Level 3 [4] (105) (73) (49)(514)(6)(44)(1)(792) (4)
Fair value as of December 31, 2013 $ 147 $ 664 $ 663 $ 1,274 $ 65 $ 69 $1,272 $ 4,154 $ 193
Changes in unrealized gains (losses)
included in net income related to
financial instruments still held at
December 31, 2013 [2] [7] $ (7) $ — $ (10) $ (9) $ — $ — $ (1) $ (27) $ 43
Freestanding Derivatives [5]
Assets (Liabilities)
Equity
Securities,
AFS Credit Equity Interest
Rate
U.S.
GMWB
Hedging
U.S.
Macro
Hedge
Program
Intl.
Program
Hedging Other
Contracts
Total Free-
Standing
Derivatives [5]
Fair value as of January 1, 2013 $ 84 $ 4 $ 57 $ (32) $ 519 $ 286 $ 68 $ 23 $ 925
Total realized/unrealized gains
(losses)
Included in net income [1], [2],
[6] (15) — (37) 24 (372)(191)(112)(6) (694)
Included in OCI [3] 6 — — — — — — — —
Purchases 14 — — (3) — 44 (38) — 3
Settlements — (2) (7) 3 (4) — (1) — (11)
Sales (3) — — — — — — — —
Transfers into Level 3 [4] — — — — — — (8) — (8)
Transfers out of Level 3 [4] (9) — (10) 26 3 — 62 — 81
Fair value as of December 31, 2013 $ 77 $ 2 $ 3 $ 18 $ 146 $ 139 $ (29) $ 17 $ 296
Changes in unrealized gains (losses)
included in net income related to
financial instruments still held at
December 31, 2013 [2] [7] $ (15) $ (1) $ (22) $ 9 $ (390) $ (187) $ (382) $ (6) $ (979)
Table of Contents THE HARTFORD FINANCIAL SERVICES GROUP, INC.
NOTES TO CONSOLIDATED FINANCIAL STATEMENTS (continued)
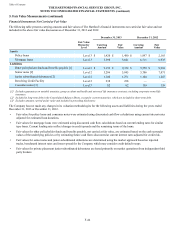
5. Fair Value Measurements (continued)