The Hartford 2013 Annual Report Download - page 57
Download and view the complete annual report
Please find page 57 of the 2013 The Hartford annual report below. You can navigate through the pages in the report by either clicking on the pages listed below, or by using the keyword search tool below to find specific information within the annual report.-
 1
1 -
2
-
3
-
4
-
5
-
6
-
7
-
8
-
9
-
10
-
11
-
12
-
13
-
14
-
15
-
16
-
17
-
18
-
19
-
20
-
21
-
22
-
23
-
24
-
25
-
26
-
27
-
28
-
29
-
30
-
31
-
32
-
33
-
34
-
35
-
36
-
37
-
38
-
39
-
40
-
41
-
42
-
43
-
44
-
45
-
46
-
 47
47 -
 48
48 -
 49
49 -
 50
50 -
 51
51 -
 52
52 -
 53
53 -
 54
54 -
 55
55 -
 56
56 -
 57
57 -
 58
58 -
 59
59 -
 60
60 -
 61
61 -
 62
62 -
 63
63 -
 64
64 -
 65
65 -
 66
66 -
 67
67 -
68
-
69
-
70
-
71
-
72
-
73
-
74
-
75
-
76
-
77
-
78
-
79
-
80
-
81
-
82
-
83
-
84
-
85
-
86
-
87
-
88
-
89
-
90
-
91
-
92
-
93
-
94
-
95
-
96
-
97
-
98
-
99
-
100
-
101
-
102
-
103
-
104
-
105
-
106
-
107
-
108
-
109
-
110
-
111
-
112
-
113
-
114
-
115
-
116
-
117
-
118
-
119
-
120
-
121
-
122
-
123
-
124
-
125
-
126
-
127
-
128
-
129
-
130
-
131
-
132
-
133
-
134
-
135
-
136
-
137
-
138
-
139
-
140
-
141
-
142
-
143
-
144
-
145
-
146
-
147
-
148
-
149
-
150
-
151
-
152
-
153
-
154
-
155
-
156
-
157
-
158
-
159
-
160
-
161
-
162
-
163
-
164
-
165
-
166
-
167
-
168
-
169
-
170
-
171
-
172
-
173
-
174
-
175
-
176
-
177
-
178
-
179
-
180
-
181
-
182
-
183
-
184
-
185
-
186
-
187
-
188
-
189
-
190
-
191
-
192
-
193
-
194
-
195
-
196
-
197
-
198
-
199
-
200
-
201
-
202
-
203
-
204
-
205
-
206
-
207
-
208
-
209
-
210
-
211
-
212
-
213
-
214
-
215
-
216
-
217
-
218
-
219
-
220
-
221
-
222
-
223
-
224
-
225
-
226
-
227
-
228
-
229
-
230
-
231
-
232
-
233
-
234
-
235
-
236
-
237
-
238
-
239
-
240
-
241
-
242
-
243
-
244
-
245
-
246
-
247
-
248
-
249
-
250
 |
 |
57
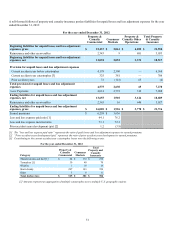
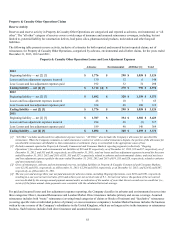
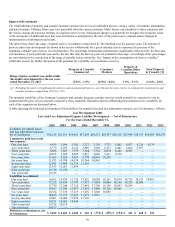
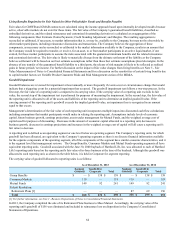
In the fourth quarters of 2013, 2012 and 2011, the Company completed evaluations of certain of its non-asbestos and environmental
reserves in Property & Casualty Other Operations, including its assumed reinsurance liabilities and in 2013, 2012, and 2011, the
Company recognized no prior year development on these reserves.
During the second quarters of 2013 and 2012 and the third quarter of 2011, the Company completed its annual ground up environmental
reserve evaluations. In each of these evaluations, the Company reviewed all of its open direct domestic insurance accounts exposed to
environmental liability as well as assumed reinsurance accounts and its London Market exposures for both direct and assumed
reinsurance. The Company found estimates for some individual account exposures increased based upon unfavorable litigation results
and increased clean-up or expense costs, with the vast majority of this deterioration emanating from a limited number of insureds. The
net effect of these account-specific changes as well as quarterly actuarial evaluations of new account emergence and historical loss and
expense paid experience resulted in $12, $10 and $19 increases in net environmental liabilities in 2013, 2012 and 2011, respectively. In
addition to the quarterly actuarial evaluations, the Company currently expects to continue to perform an evaluation of its environmental
liabilities annually.
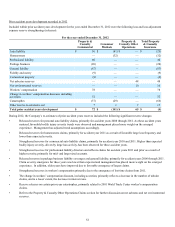
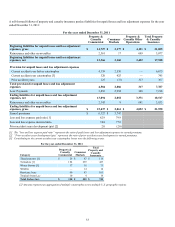
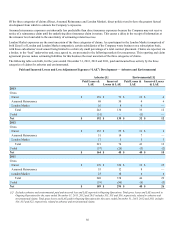
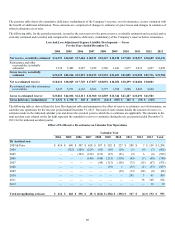
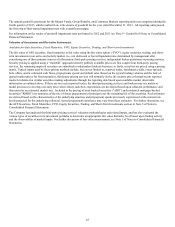
During the second quarters of 2013, 2012 and 2011, the Company completed its annual ground-up asbestos reserve evaluations. As part
of these evaluations, the Company reviewed all of its open direct domestic insurance accounts exposed to asbestos liability, as well as
assumed reinsurance accounts and its London Market exposures for both direct insurance and assumed reinsurance. During 2013, the
Company found estimates for individual cases changed based upon the particular circumstances in such accounts. These cases were case
specific and not as a result of any underlying change in current environment. The Company experienced moderate increases in claim
frequency and severity as well as expense and costs associated with litigating asbestos coverage matters, particularly against certain
smaller, more peripheral insureds. The Company also experienced unfavorable development on certain of its assumed reinsurance
accounts driven largely by the same factors experience by the direct policyholders. Based on this evaluation, the Company strengthened
its net asbestos reserves by $130 in second quarter 2013. During 2012, the Company found estimates for individual cases changed based
upon the particular circumstances of such accounts. These changes were case specific and not as a result of any underlying change in the
current environment. The Company experienced moderate increases in claim severity, expense and costs associated with litigating
asbestos coverage matters, particularly against certain smaller, more peripheral insureds. The Company also experienced unfavorable
development on certain of its assumed reinsurance accounts driven largely by the same factors experienced by direct policy holders.
Based on this evaluation, the Company strengthened its net asbestos reserves by $48 in second quarter 2012. During 2011, for certain
direct policyholders, the Company experienced increases in claim frequency, severity and expense which were driven by mesothelioma
claims, particularly against certain smaller, more peripheral insureds. The Company also experienced unfavorable development on its
assumed reinsurance accounts driven largely by the same factors experienced by the direct policyholders. Based on this evaluation, the
Company strengthened its net asbestos reserves by $290 in second quarter 2011. The Company currently expects to continue to perform
an evaluation of its asbestos liabilities annually.
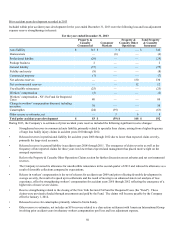
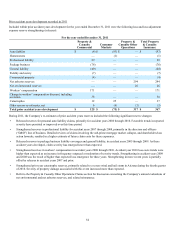
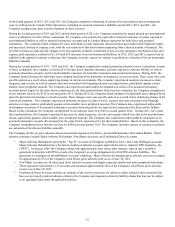
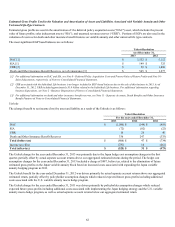
The Company divides its gross asbestos and environmental exposures into Direct, Assumed Reinsurance and London Market. Direct
asbestos exposures include Major Asbestos Defendants, Non-Major Accounts, and Unallocated Direct Accounts.
• Major Asbestos Defendants represent the “Top 70” accounts in Tillinghast's published Tiers 1 and 2 and Wellington accounts.
Major Asbestos Defendants have the fewest number of asbestos accounts and include reserves related to PPG Industries, Inc.
(“PPG”). In January 2009, the Company, along with approximately three dozen other insurers, entered into a modified
agreement in principle with PPG to resolve the Company's coverage obligations for all its PPG asbestos liabilities. The
agreement is contingent on the fulfillment of certain conditions. Major Asbestos Defendants gross asbestos reserves accounted
for approximately 29% of the Company's total Direct gross asbestos reserves as of June 30, 2013.
• Non-Major Accounts are all other open direct asbestos accounts and largely represent smaller and more peripheral defendants.
These exposures represented 1,125 accounts and contained approximately 44% of the Company's total Direct gross asbestos
reserves as of June 30, 2013.
• Unallocated Direct Accounts includes an estimate of the reserves necessary for asbestos claims related to direct insureds that
have not previously tendered asbestos claims to the Company and exposures related to liability claims that may not be subject
to an aggregate limit under the applicable policies.