The Hartford 2013 Annual Report Download - page 232
Download and view the complete annual report
Please find page 232 of the 2013 The Hartford annual report below. You can navigate through the pages in the report by either clicking on the pages listed below, or by using the keyword search tool below to find specific information within the annual report.-
 1
1 -
2
-
3
-
4
-
5
-
6
-
7
-
8
-
9
-
10
-
11
-
12
-
13
-
14
-
15
-
16
-
17
-
18
-
19
-
20
-
21
-
22
-
23
-
24
-
25
-
26
-
27
-
28
-
29
-
30
-
31
-
32
-
33
-
34
-
35
-
36
-
37
-
38
-
39
-
40
-
41
-
42
-
43
-
44
-
45
-
46
-
47
-
48
-
49
-
50
-
51
-
52
-
53
-
54
-
55
-
56
-
57
-
58
-
59
-
60
-
61
-
62
-
63
-
64
-
65
-
66
-
67
-
68
-
69
-
70
-
71
-
72
-
73
-
74
-
75
-
76
-
77
-
78
-
79
-
80
-
81
-
82
-
83
-
84
-
85
-
86
-
87
-
88
-
89
-
90
-
91
-
92
-
93
-
94
-
95
-
96
-
97
-
98
-
99
-
100
-
101
-
102
-
103
-
104
-
105
-
106
-
107
-
108
-
109
-
110
-
111
-
112
-
113
-
114
-
115
-
116
-
117
-
118
-
119
-
120
-
121
-
122
-
123
-
124
-
125
-
126
-
127
-
128
-
129
-
130
-
131
-
132
-
133
-
134
-
135
-
136
-
137
-
138
-
139
-
140
-
141
-
142
-
143
-
144
-
145
-
146
-
147
-
148
-
149
-
150
-
151
-
152
-
153
-
154
-
155
-
156
-
157
-
158
-
159
-
160
-
161
-
162
-
163
-
164
-
165
-
166
-
167
-
168
-
169
-
170
-
171
-
172
-
173
-
174
-
175
-
176
-
177
-
178
-
179
-
180
-
181
-
182
-
183
-
184
-
185
-
186
-
187
-
188
-
189
-
190
-
191
-
192
-
193
-
194
-
195
-
196
-
197
-
198
-
199
-
200
-
201
-
202
-
203
-
204
-
205
-
206
-
207
-
208
-
209
-
210
-
211
-
212
-
213
-
214
-
215
-
216
-
217
-
218
-
219
-
220
-
221
-
 222
222 -
 223
223 -
 224
224 -
 225
225 -
 226
226 -
 227
227 -
 228
228 -
 229
229 -
 230
230 -
 231
231 -
 232
232 -
 233
233 -
 234
234 -
 235
235 -
 236
236 -
 237
237 -
 238
238 -
 239
239 -
 240
240 -
 241
241 -
 242
242 -
243
-
244
-
245
-
246
-
247
-
248
-
249
-
250
 |
 |

F-96
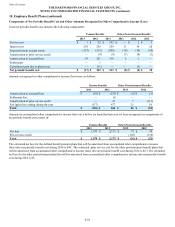
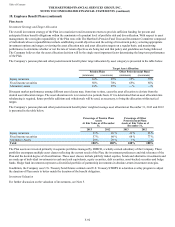
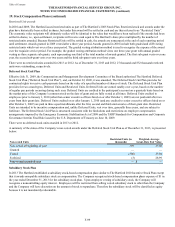
Cash Flows
The following table illustrates the Company’s prior contributions.
Employer Contributions Pension Benefits Other Postretirement Benefits
2013 $ 101 $ —
2012 $ 201 $ —
In 2013, the Company, at its discretion, made $100 in contributions to the U.S. qualified defined benefit pension plan. The Company does
not have a 2014 required minimum funding contribution for the U.S. qualified defined benefit pension plan. The Company has not determined
whether, and to what extent, contributions may be made to the U. S. qualified defined benefit pension plan in 2014. The Company will
monitor the funded status of the U.S. qualified defined benefit pension plan during 2014 to make this determination.
Employer contributions in 2013 and 2012 were made in cash and did not include contributions of the Company’s common stock.
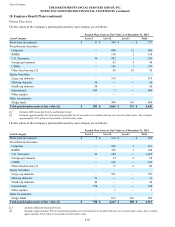
Benefit Payments
The following table sets forth amounts of benefits expected to be paid over the next ten years from the Company’s pension and other
postretirement plans as of December 31, 2013:
Pension Benefits Other Postretirement Benefits
2014 $ 324 $ 43
2015 310 40
2016 317 37
2017 324 34
2018 331 32
2019 - 2023 1,740 121
Total $ 3,346 $ 307
In addition, the following table sets forth amounts of other postretirement benefits expected to be received under the Medicare Part D
Subsidy over the next ten years as of December 31, 2013:
2014 $ 3
2015 3
2016 4
2017 4
2018 4
2019 - 2023 22
Total $ 40
Investment and Savings Plan
Substantially all U.S. employees of the Company are eligible to participate in The Hartford Investment and Savings Plan under which
designated contributions may be invested in common stock of The Hartford or certain other investments. The Company's contributions
include a non-elective contribution of 2.0% of eligible compensation and a dollar-for-dollar matching contribution of up to 6.0% of eligible
compensation contributed by the employee each pay period. The Company also maintains a non-qualified savings plan, The Hartford Excess
Savings Plan, with the same level of Company contributions, with respect to employee compensation in excess of the limit that can be
recognized under the tax-qualified Investment and Savings Plan. Eligible compensation includes overtime and bonuses but is limited to a
total, for the Investment and Savings Plan and Excess Savings Plan combined, of $1 annually. The total cost to The Hartford for these plans
was approximately $123 for 2013.
Prior to January 1, 2013, the contributions to The Hartford Investment and Savings Plan were matched, up to 3.0% of base salary, by the
Company. In 2012, employees who had earnings of less than $110 thousand in the preceding year also received a contribution of 1.5% of
base salary and employees who had earnings of $110 thousand or more in the preceding year received a contribution of 0.5% of base
salary. The cost to The Hartford for this plan was approximately $58, and $59 for 2012 and 2011, respectively.
Additionally, The Hartford has established defined contribution pension plans for certain employees of the Company’s international
subsidiaries. The cost to The Hartford in 2013, 2012, and 2011 for these plans was immaterial.
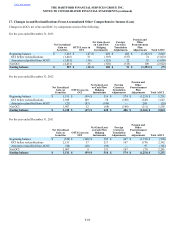
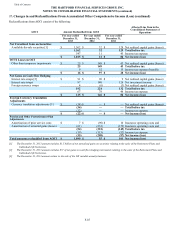
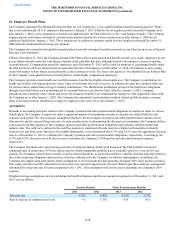
Table of Contents THE HARTFORD FINANCIAL SERVICES GROUP, INC.
NOTES TO CONSOLIDATED FINANCIAL STATEMENTS (continued)
18. Employee Benefit Plans (continued)