The Hartford 2013 Annual Report Download - page 195
Download and view the complete annual report
Please find page 195 of the 2013 The Hartford annual report below. You can navigate through the pages in the report by either clicking on the pages listed below, or by using the keyword search tool below to find specific information within the annual report.-
 1
1 -
2
-
3
-
4
-
5
-
6
-
7
-
8
-
9
-
10
-
11
-
12
-
13
-
14
-
15
-
16
-
17
-
18
-
19
-
20
-
21
-
22
-
23
-
24
-
25
-
26
-
27
-
28
-
29
-
30
-
31
-
32
-
33
-
34
-
35
-
36
-
37
-
38
-
39
-
40
-
41
-
42
-
43
-
44
-
45
-
46
-
47
-
48
-
49
-
50
-
51
-
52
-
53
-
54
-
55
-
56
-
57
-
58
-
59
-
60
-
61
-
62
-
63
-
64
-
65
-
66
-
67
-
68
-
69
-
70
-
71
-
72
-
73
-
74
-
75
-
76
-
77
-
78
-
79
-
80
-
81
-
82
-
83
-
84
-
85
-
86
-
87
-
88
-
89
-
90
-
91
-
92
-
93
-
94
-
95
-
96
-
97
-
98
-
99
-
100
-
101
-
102
-
103
-
104
-
105
-
106
-
107
-
108
-
109
-
110
-
111
-
112
-
113
-
114
-
115
-
116
-
117
-
118
-
119
-
120
-
121
-
122
-
123
-
124
-
125
-
126
-
127
-
128
-
129
-
130
-
131
-
132
-
133
-
134
-
135
-
136
-
137
-
138
-
139
-
140
-
141
-
142
-
143
-
144
-
145
-
146
-
147
-
148
-
149
-
150
-
151
-
152
-
153
-
154
-
155
-
156
-
157
-
158
-
159
-
160
-
161
-
162
-
163
-
164
-
165
-
166
-
167
-
168
-
169
-
170
-
171
-
172
-
173
-
174
-
175
-
176
-
177
-
178
-
179
-
180
-
181
-
182
-
183
-
184
-
 185
185 -
 186
186 -
 187
187 -
 188
188 -
 189
189 -
 190
190 -
 191
191 -
 192
192 -
 193
193 -
 194
194 -
 195
195 -
 196
196 -
 197
197 -
 198
198 -
 199
199 -
 200
200 -
 201
201 -
 202
202 -
 203
203 -
 204
204 -
 205
205 -
206
-
207
-
208
-
209
-
210
-
211
-
212
-
213
-
214
-
215
-
216
-
217
-
218
-
219
-
220
-
221
-
222
-
223
-
224
-
225
-
226
-
227
-
228
-
229
-
230
-
231
-
232
-
233
-
234
-
235
-
236
-
237
-
238
-
239
-
240
-
241
-
242
-
243
-
244
-
245
-
246
-
247
-
248
-
249
-
250
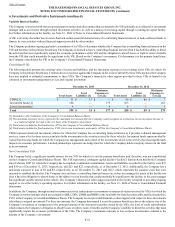
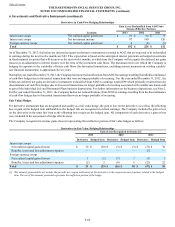
 |
 |

F-59
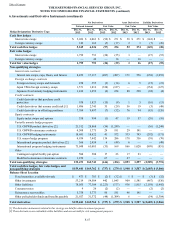
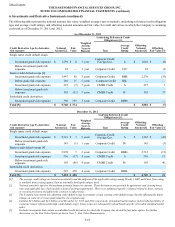
Gross
Amounts of
Recognized
Liabilities
Gross Amounts
Offset in the
Statement of
Financial Position Derivative
Liabilities [3]
Accrued
Interest and
Cash Collateral
Pledged [3] Financial Collateral
Pledged [4] Net Amount
Description
Other liabilities $ (2,626) $ (1,496) $ (1,223) $ 93 $ (1,204) $ 74
As of December 31, 2012
(i) (ii) (iii) = (i) - (ii) (iv) (v) = (iii) -
(iv)
Net Amounts Presented in the
Statement of Financial Position
Collateral
Disallowed for
Offset in the
Statement of
Financial Position
Gross
Amounts of
Recognized
Assets
Gross Amounts
Offset in the
Statement of
Financial Position Derivative
Assets [1]
Accrued
Interest and
Cash Collateral
Received [2] Financial Collateral
Received [4] Net Amount
Description
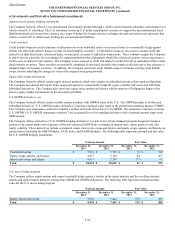
Other investments $ 3,396 $ 2,503 $ 1,045 $ (152) $ 759 $ 134
Gross
Amounts of
Recognized
Liabilities
Gross Amounts
Offset in the
Statement of
Financial Position Derivative
Liabilities [3]
Accrued
Interest and
Cash Collateral
Pledged [3] Financial Collateral
Pledged [4] Net Amount
Description
Other liabilities $ (2,528) $ (1,895) $ (177) $ (456) $ (541) $ (92)
[1] Included in other investments in the Company's Consolidated Balance Sheets.
[2] Included in other assets in the Company's Consolidated Balance Sheets and is limited to the net derivative receivable associated with each
counterparty.
[3] Included in other liabilities in the Company's Consolidated Balance Sheets and is limited to the net derivative payable associated with each
counterparty.
[4] Excludes collateral associated with exchange-traded derivatives instruments.
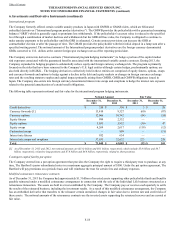
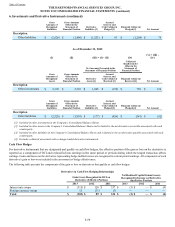
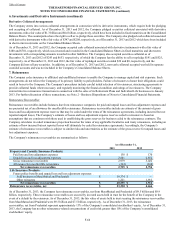
Cash Flow Hedges
For derivative instruments that are designated and qualify as cash flow hedges, the effective portion of the gain or loss on the derivative is
reported as a component of OCI and reclassified into earnings in the same period or periods during which the hedged transaction affects
earnings. Gains and losses on the derivative representing hedge ineffectiveness are recognized in current period earnings. All components of each
derivative’s gain or loss were included in the assessment of hedge effectiveness.
The following table presents the components of the gain or loss on derivatives that qualify as cash flow hedges:
Derivatives in Cash Flow Hedging Relationships
Gain (Loss) Recognized in OCI on
Derivative (Effective Portion)
Net Realized Capital Gains(Losses)
Recognized in Income on Derivative
(Ineffective Portion)
2013 2012 2011 2013 2012 2011
Interest rate swaps $ (315) $ 120 $ 337 $ (3) $ — $ (4)
Foreign currency swaps 12 (31) (3) — — —
Total $ (303) $ 89 $ 334 $ (3) $ — $ (4)
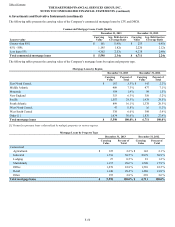
Table of Contents THE HARTFORD FINANCIAL SERVICES GROUP, INC.
NOTES TO CONSOLIDATED FINANCIAL STATEMENTS (continued)
6. Investments and Derivative Instruments (continued)