The Hartford 2013 Annual Report Download - page 60
Download and view the complete annual report
Please find page 60 of the 2013 The Hartford annual report below. You can navigate through the pages in the report by either clicking on the pages listed below, or by using the keyword search tool below to find specific information within the annual report.-
 1
1 -
2
-
3
-
4
-
5
-
6
-
7
-
8
-
9
-
10
-
11
-
12
-
13
-
14
-
15
-
16
-
17
-
18
-
19
-
20
-
21
-
22
-
23
-
24
-
25
-
26
-
27
-
28
-
29
-
30
-
31
-
32
-
33
-
34
-
35
-
36
-
37
-
38
-
39
-
40
-
41
-
42
-
43
-
44
-
45
-
46
-
47
-
48
-
49
-
 50
50 -
 51
51 -
 52
52 -
 53
53 -
 54
54 -
 55
55 -
 56
56 -
 57
57 -
 58
58 -
 59
59 -
 60
60 -
 61
61 -
 62
62 -
 63
63 -
 64
64 -
 65
65 -
 66
66 -
 67
67 -
 68
68 -
 69
69 -
 70
70 -
71
-
72
-
73
-
74
-
75
-
76
-
77
-
78
-
79
-
80
-
81
-
82
-
83
-
84
-
85
-
86
-
87
-
88
-
89
-
90
-
91
-
92
-
93
-
94
-
95
-
96
-
97
-
98
-
99
-
100
-
101
-
102
-
103
-
104
-
105
-
106
-
107
-
108
-
109
-
110
-
111
-
112
-
113
-
114
-
115
-
116
-
117
-
118
-
119
-
120
-
121
-
122
-
123
-
124
-
125
-
126
-
127
-
128
-
129
-
130
-
131
-
132
-
133
-
134
-
135
-
136
-
137
-
138
-
139
-
140
-
141
-
142
-
143
-
144
-
145
-
146
-
147
-
148
-
149
-
150
-
151
-
152
-
153
-
154
-
155
-
156
-
157
-
158
-
159
-
160
-
161
-
162
-
163
-
164
-
165
-
166
-
167
-
168
-
169
-
170
-
171
-
172
-
173
-
174
-
175
-
176
-
177
-
178
-
179
-
180
-
181
-
182
-
183
-
184
-
185
-
186
-
187
-
188
-
189
-
190
-
191
-
192
-
193
-
194
-
195
-
196
-
197
-
198
-
199
-
200
-
201
-
202
-
203
-
204
-
205
-
206
-
207
-
208
-
209
-
210
-
211
-
212
-
213
-
214
-
215
-
216
-
217
-
218
-
219
-
220
-
221
-
222
-
223
-
224
-
225
-
226
-
227
-
228
-
229
-
230
-
231
-
232
-
233
-
234
-
235
-
236
-
237
-
238
-
239
-
240
-
241
-
242
-
243
-
244
-
245
-
246
-
247
-
248
-
249
-
250
 |
 |

60
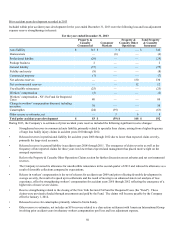
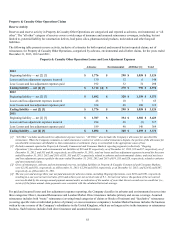
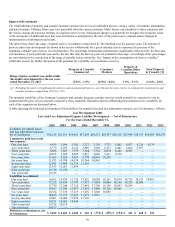
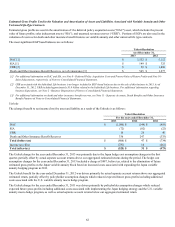
The previous table shows the cumulative deficiency (redundancy) of the Company’s reserves, net of reinsurance, as now estimated with
the benefit of additional information. Those amounts are comprised of changes in estimates of gross losses and changes in estimates of
related reinsurance recoveries.
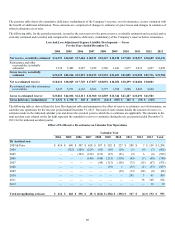
The following table, for the periods presented, reconciles the net reserves to the gross reserves, as initially estimated and recorded, and as
currently estimated and recorded, and computes the cumulative deficiency (redundancy) of the Company’s reserves before reinsurance.
Loss And Loss Adjustment Expense Liability Development — Gross
For the Years Ended December 31,
2004 2005 2006 2007 2008 2009 2010 2011 2012 2013
Net reserve, as initially estimated $16,191 $16,863 $17,604 $18,231 $18,347 $18,210 $17,948 $18,517 $18,689 $18,676
Reinsurance and other
recoverables, as initially
estimated 5,138 5,403 4,387 3,922 3,586 3,441 3,077 3,033 3,027 3,028
Gross reserve, as initially
estimated $21,329 $22,266 $21,991 $22,153 $21,933 $21,651 $21,025 $21,550 $21,716 $21,704
Net re-estimated reserve $18,214 $18,045 $17,749 $17,857 $18,092 $18,056 $18,299 $18,686 $18,881
Re-estimated and other reinsurance
recoverables 5,647 5,971 4,362 4,103 3,777 3,288 2,988 2,805 2,620
Gross re-estimated reserve $23,861 $24,016 $22,111 $21,960 $21,869 $21,344 $21,287 $21,491 $21,501
Gross deficiency (redundancy) $ 2,532 $ 1,750 $ 120 $ (193) $ (64) $ (307) $ 262 $ (59) $ (215)
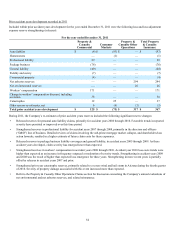
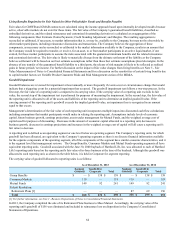
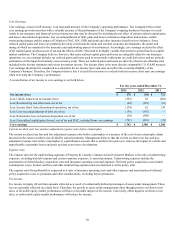
The following table is derived from the Loss Development table and summarizes the effect of reserve re-estimates, net of reinsurance, on
calendar year operations for the ten-year period ended December 31, 2013. The total of each column details the amount of reserve re-
estimates made in the indicated calendar year and shows the accident years to which the re-estimates are applicable. The amounts in the
total accident year column on the far right represent the cumulative reserve re-estimates during the ten year period ended December 31,
2013 for the indicated accident year(s).
Effect of Net Reserve Re-estimates on Calendar Year Operations
Calendar Year
2004 2005 2006 2007 2008 2009 2010 2011 2012 2013 Total
By Accident year
2003 & Prior $ 414 $ 600 $ 507 $ 628 $ 187 $ 282 $ 227 $ 288 $ 7 $ 158 $ 3,298
2004 — (352) (108)(226)(83)(56)(20)(1)(9)(7) (862)
2005 — — (103)(214)(133)(47)(91)(5) 6 (6) (593)
2006 — — — (140)(148)(213)(118)(45)(7)(69) (740)
2007 — — — — (49)(113)(156)(71)(15)(67) (471)
2008 — — — — — (39) 1 (31)(1)(37) (107)
2009 — — — — — — (39)(13)(24)(8) (84)
2010 — — — — — — — 245 3 61 309
2011 — — — — — — — — 36 148 184
2012 — — — — — — — — — 19 19
Total strengthening (release) $ 414 $ 248 $ 296 $ 48 $ (226) $ (186) $ (196) $ 367 $ (4) $ 192 $ 953