The Hartford 2013 Annual Report Download - page 166
Download and view the complete annual report
Please find page 166 of the 2013 The Hartford annual report below. You can navigate through the pages in the report by either clicking on the pages listed below, or by using the keyword search tool below to find specific information within the annual report.-
 1
1 -
2
-
3
-
4
-
5
-
6
-
7
-
8
-
9
-
10
-
11
-
12
-
13
-
14
-
15
-
16
-
17
-
18
-
19
-
20
-
21
-
22
-
23
-
24
-
25
-
26
-
27
-
28
-
29
-
30
-
31
-
32
-
33
-
34
-
35
-
36
-
37
-
38
-
39
-
40
-
41
-
42
-
43
-
44
-
45
-
46
-
47
-
48
-
49
-
50
-
51
-
52
-
53
-
54
-
55
-
56
-
57
-
58
-
59
-
60
-
61
-
62
-
63
-
64
-
65
-
66
-
67
-
68
-
69
-
70
-
71
-
72
-
73
-
74
-
75
-
76
-
77
-
78
-
79
-
80
-
81
-
82
-
83
-
84
-
85
-
86
-
87
-
88
-
89
-
90
-
91
-
92
-
93
-
94
-
95
-
96
-
97
-
98
-
99
-
100
-
101
-
102
-
103
-
104
-
105
-
106
-
107
-
108
-
109
-
110
-
111
-
112
-
113
-
114
-
115
-
116
-
117
-
118
-
119
-
120
-
121
-
122
-
123
-
124
-
125
-
126
-
127
-
128
-
129
-
130
-
131
-
132
-
133
-
134
-
135
-
136
-
137
-
138
-
139
-
140
-
141
-
142
-
143
-
144
-
145
-
146
-
147
-
148
-
149
-
150
-
151
-
152
-
153
-
154
-
155
-
 156
156 -
 157
157 -
 158
158 -
 159
159 -
 160
160 -
 161
161 -
 162
162 -
 163
163 -
 164
164 -
 165
165 -
 166
166 -
 167
167 -
 168
168 -
 169
169 -
 170
170 -
 171
171 -
 172
172 -
 173
173 -
 174
174 -
 175
175 -
 176
176 -
177
-
178
-
179
-
180
-
181
-
182
-
183
-
184
-
185
-
186
-
187
-
188
-
189
-
190
-
191
-
192
-
193
-
194
-
195
-
196
-
197
-
198
-
199
-
200
-
201
-
202
-
203
-
204
-
205
-
206
-
207
-
208
-
209
-
210
-
211
-
212
-
213
-
214
-
215
-
216
-
217
-
218
-
219
-
220
-
221
-
222
-
223
-
224
-
225
-
226
-
227
-
228
-
229
-
230
-
231
-
232
-
233
-
234
-
235
-
236
-
237
-
238
-
239
-
240
-
241
-
242
-
243
-
244
-
245
-
246
-
247
-
248
-
249
-
250
 |
 |

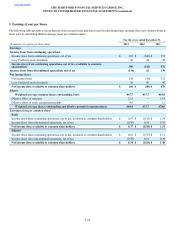
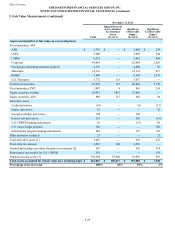
F-30
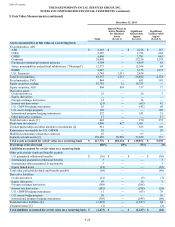
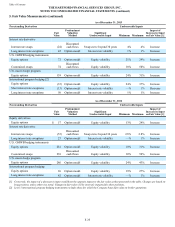
December 31, 2012
Total
Quoted Prices
in Active
Markets for
Identical Assets
(Level 1)
Significant
Observable
Inputs
(Level 2)
Significant
Unobservable
Inputs
(Level 3)
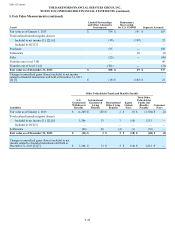
Liabilities accounted for at fair value on a recurring basis
Other policyholder funds and benefits payable
U.S guaranteed withdrawal benefits $ (1,249) $ — $ — $ (1,249)
International guaranteed withdrawal benefits (50) — — (50)
International other guaranteed living benefits 2 — — 2
Equity linked notes (7) — — (7)
Total other policyholder funds and benefits payable (1,304) — — (1,304)
Derivative liabilities
Credit derivatives (18) — (33) 15
Equity derivatives 25 — — 25
Foreign exchange derivatives (24) — (24) —
Interest rate derivatives (517) — (518) 1
U.S. GMWB hedging instruments 536 — 106 430
U.S Macro hedge program 100 — — 100
International program hedging instruments (279) — (217) (62)
Total derivative liabilities [4] (177) — (686) 509
Other liabilities — — — —
Consumer notes [5] (2) — — (2)
Total liabilities accounted for at fair value on a recurring basis $ (1,483) $ — $ (686) $ (797)
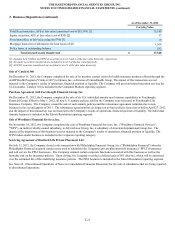
[1] Includes OTC and OTC-cleared derivative instruments in a net asset value position after consideration of the impact of collateral
posting requirements, which may be imposed by agreements, clearinghouse rules, and applicable law. As of December 31, 2013 and
2012, $128 and $160, respectively, was netted against the derivative asset value in the Consolidated Balance Sheet and is excluded from
the table above. See footnote 4 below for derivative liabilities.
[2] Represents hedge funds where investment company accounting has been applied to a wholly-owned fund of funds measured at fair value.
[3] Approximately $2.4 billion and $3.1 billion of investment sales receivable that are not subject to fair value accounting are excluded as of
December 31, 2013 and 2012, respectively.
[4] Includes OTC and OTC-cleared derivative instruments in a net negative market value position (derivative liability). In the Level 3 roll-
forward table included below in this Note 5, the sum of the derivative asset and liability positions are referred to as “freestanding
derivatives” and are presented on a net basis.
[5] Represents embedded derivatives associated with non-funding agreement-backed consumer equity linked notes.
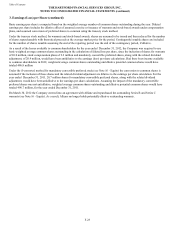
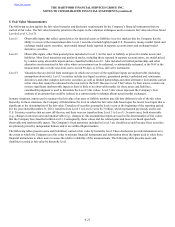
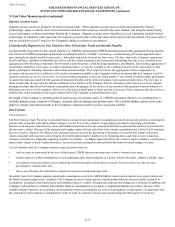
Determination of Fair Values
The valuation methodologies used to determine the fair values of assets and liabilities under the “exit price” notion, reflect market-
participant objectives and are based on the application of the fair value hierarchy that prioritizes relevant observable market inputs over
unobservable inputs. The Company determines the fair values of certain financial assets and financial liabilities based on quoted market
prices where available and where prices represent a reasonable estimate of fair value. The Company also determines fair value based on
future cash flows discounted at the appropriate current market rate. Fair values reflect adjustments for counterparty credit quality, the
Company’s default spreads, liquidity and, where appropriate, risk margins on unobservable parameters. The following is a discussion of the
methodologies used to determine fair values for the financial instruments listed in the above tables.
The fair value process is monitored by the Valuation Committee, which is a cross-functional group of senior management within the
Company that meets at least quarterly. The Valuation Committee is co-chaired by the Heads of Investment Operations and Accounting, and
has representation from various investment sector professionals, accounting, operations, legal, compliance and risk management. The
purpose of the committee is to oversee the pricing policy and procedures by ensuring objective and reliable valuation practices and pricing
of financial instruments, as well as addressing fair valuation issues and approving changes to valuation methodologies and pricing sources.
There are also two working groups, a Securities Fair Value Working Group (“Securities Working Group”) and a Derivatives Fair Value
Working Group ("Derivatives Working Group"), which include the Heads of Investment Operations and Accounting, as well as other
investment, operations, accounting and risk management professionals that meet monthly to review market data trends, pricing and trading
statistics and results, and any proposed pricing methodology changes described in more detail in the following paragraphs.
Table of Contents THE HARTFORD FINANCIAL SERVICES GROUP, INC.
NOTES TO CONSOLIDATED FINANCIAL STATEMENTS (continued)
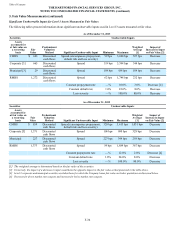
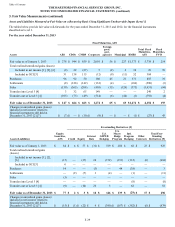
5. Fair Value Measurements (continued)