The Hartford 2013 Annual Report Download - page 32
Download and view the complete annual report
Please find page 32 of the 2013 The Hartford annual report below. You can navigate through the pages in the report by either clicking on the pages listed below, or by using the keyword search tool below to find specific information within the annual report.-
 1
1 -
 2
2 -
 3
3 -
 4
4 -
 5
5 -
 6
6 -
 7
7 -
 8
8 -
 9
9 -
 10
10 -
 11
11 -
 12
12 -
 13
13 -
 14
14 -
 15
15 -
 16
16 -
 17
17 -
 18
18 -
 19
19 -
 20
20 -
 21
21 -
 22
22 -
 23
23 -
 24
24 -
 25
25 -
 26
26 -
 27
27 -
 28
28 -
 29
29 -
 30
30 -
 31
31 -
 32
32 -
 33
33 -
 34
34 -
 35
35 -
 36
36 -
 37
37 -
 38
38 -
 39
39 -
 40
40 -
 41
41 -
 42
42 -
 43
43 -
 44
44 -
 45
45 -
 46
46 -
 47
47 -
 48
48 -
 49
49 -
 50
50 -
 51
51 -
 52
52 -
 53
53 -
 54
54 -
 55
55 -
 56
56 -
 57
57 -
 58
58 -
 59
59 -
 60
60 -
 61
61 -
 62
62 -
 63
63 -
 64
64 -
 65
65 -
 66
66 -
 67
67 -
 68
68 -
 69
69 -
 70
70 -
 71
71 -
 72
72 -
 73
73 -
 74
74 -
 75
75 -
 76
76 -
 77
77 -
 78
78 -
 79
79 -
 80
80 -
 81
81 -
 82
82 -
 83
83 -
 84
84 -
 85
85 -
 86
86 -
 87
87 -
 88
88 -
 89
89 -
 90
90 -
 91
91 -
 92
92 -
 93
93 -
 94
94 -
 95
95 -
 96
96 -
 97
97 -
 98
98 -
 99
99 -
 100
100 -
 101
101 -
 102
102 -
 103
103 -
 104
104 -
 105
105 -
 106
106 -
 107
107 -
 108
108 -
 109
109 -
 110
110 -
 111
111 -
 112
112 -
 113
113 -
 114
114 -
 115
115 -
 116
116 -
 117
117 -
 118
118 -
 119
119 -
 120
120 -
 121
121 -
 122
122 -
 123
123 -
 124
124 -
 125
125 -
 126
126 -
 127
127 -
 128
128 -
 129
129 -
 130
130 -
 131
131 -
 132
132 -
 133
133 -
 134
134 -
 135
135 -
 136
136 -
 137
137 -
 138
138 -
 139
139 -
 140
140 -
 141
141 -
 142
142 -
 143
143 -
 144
144 -
 145
145 -
 146
146 -
 147
147 -
 148
148 -
 149
149 -
 150
150 -
 151
151 -
 152
152 -
 153
153 -
 154
154 -
 155
155 -
 156
156 -
 157
157 -
 158
158 -
 159
159 -
 160
160 -
 161
161 -
 162
162 -
 163
163 -
 164
164 -
 165
165 -
 166
166 -
 167
167 -
 168
168 -
 169
169 -
 170
170 -
 171
171 -
 172
172 -
 173
173 -
 174
174 -
 175
175 -
 176
176 -
 177
177 -
 178
178 -
 179
179 -
 180
180 -
 181
181 -
 182
182 -
 183
183 -
 184
184 -
 185
185 -
 186
186 -
 187
187 -
 188
188 -
 189
189 -
 190
190 -
 191
191 -
 192
192 -
 193
193 -
 194
194 -
 195
195 -
 196
196 -
 197
197 -
 198
198 -
 199
199 -
 200
200 -
 201
201 -
 202
202 -
 203
203 -
 204
204 -
 205
205 -
 206
206 -
 207
207 -
 208
208 -
 209
209 -
 210
210 -
 211
211 -
 212
212 -
 213
213 -
 214
214 -
 215
215 -
 216
216 -
 217
217 -
 218
218 -
 219
219 -
 220
220 -
 221
221 -
 222
222 -
 223
223 -
 224
224 -
 225
225 -
 226
226 -
 227
227 -
 228
228 -
 229
229 -
 230
230 -
 231
231 -
 232
232 -
 233
233 -
 234
234 -
 235
235 -
 236
236 -
 237
237 -
 238
238 -
 239
239 -
 240
240 -
 241
241 -
 242
242 -
 243
243 -
 244
244 -
 245
245 -
 246
246 -
 247
247 -
 248
248 -
 249
249 -
 250
250
 |
 |

32
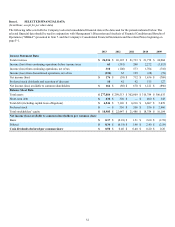
Item 6. SELECTED FINANCIAL DATA
(In millions, except for per share data)
The following table sets forth the Company's selected consolidated financial data at the dates and for the periods indicated below. The
selected financial data should be read in conjunction with Management’s Discussion and Analysis of Financial Condition and Results of
Operations ("MD&A") presented in Item 7. and the Company's Consolidated Financial Statements and the related Notes beginning on
page F-1.
2013 2012 2011 2010 2009
Income Statement Data
Total revenues $ 26,236 $ 26,122 $ 21,733 $ 21,770 $ 24,004
Income (loss) from continuing operations before income taxes 63 (581) 200 2,272 (1,515)
Income (loss) from continuing operations, net of tax 310 (100) 573 1,704 (710)
Income (loss) from discontinued operations, net of tax (134)62 139 (68) (59)
Net income (loss) $ 176 $(38) $ 712 $ 1,636 $ (769)
Preferred stock dividends and accretion of discount 10 42 42 515 127
Net income (loss) available to common shareholders $ 166 $(80) $ 670 $ 1,121 $ (896)
Balance Sheet Data
Total assets $ 277,884 $ 298,513 $ 302,609 $ 316,789 $ 306,035
Short-term debt $ 438 $ 320 $ — $ 400 $ 343
Total debt (including capital lease obligations) $ 6,544 $ 7,126 $ 6,216 $ 6,607 $ 5,839
Preferred stock $ — $ 556 $ 556 $ 556 $ 2,960
Total stockholders’ equity $ 18,905 $ 22,447 $ 21,486 $ 18,754 $ 16,184
Net income (loss) available to common shareholders per common share
Basic $ 0.37 $(0.18) $ 1.51 $ 2.60 $ (2.59)
Diluted $ 0.34 $(0.18) $ 1.40 $ 2.40 $ (2.59)
Cash dividends declared per common share $ 0.50 $ 0.40 $ 0.40 $ 0.20 $ 0.20
