The Hartford 2013 Annual Report Download - page 75
Download and view the complete annual report
Please find page 75 of the 2013 The Hartford annual report below. You can navigate through the pages in the report by either clicking on the pages listed below, or by using the keyword search tool below to find specific information within the annual report.-
 1
1 -
2
-
3
-
4
-
5
-
6
-
7
-
8
-
9
-
10
-
11
-
12
-
13
-
14
-
15
-
16
-
17
-
18
-
19
-
20
-
21
-
22
-
23
-
24
-
25
-
26
-
27
-
28
-
29
-
30
-
31
-
32
-
33
-
34
-
35
-
36
-
37
-
38
-
39
-
40
-
41
-
42
-
43
-
44
-
45
-
46
-
47
-
48
-
49
-
50
-
51
-
52
-
53
-
54
-
55
-
56
-
57
-
58
-
59
-
60
-
61
-
62
-
63
-
64
-
 65
65 -
 66
66 -
 67
67 -
 68
68 -
 69
69 -
 70
70 -
 71
71 -
 72
72 -
 73
73 -
 74
74 -
 75
75 -
 76
76 -
 77
77 -
 78
78 -
 79
79 -
 80
80 -
 81
81 -
 82
82 -
 83
83 -
 84
84 -
 85
85 -
86
-
87
-
88
-
89
-
90
-
91
-
92
-
93
-
94
-
95
-
96
-
97
-
98
-
99
-
100
-
101
-
102
-
103
-
104
-
105
-
106
-
107
-
108
-
109
-
110
-
111
-
112
-
113
-
114
-
115
-
116
-
117
-
118
-
119
-
120
-
121
-
122
-
123
-
124
-
125
-
126
-
127
-
128
-
129
-
130
-
131
-
132
-
133
-
134
-
135
-
136
-
137
-
138
-
139
-
140
-
141
-
142
-
143
-
144
-
145
-
146
-
147
-
148
-
149
-
150
-
151
-
152
-
153
-
154
-
155
-
156
-
157
-
158
-
159
-
160
-
161
-
162
-
163
-
164
-
165
-
166
-
167
-
168
-
169
-
170
-
171
-
172
-
173
-
174
-
175
-
176
-
177
-
178
-
179
-
180
-
181
-
182
-
183
-
184
-
185
-
186
-
187
-
188
-
189
-
190
-
191
-
192
-
193
-
194
-
195
-
196
-
197
-
198
-
199
-
200
-
201
-
202
-
203
-
204
-
205
-
206
-
207
-
208
-
209
-
210
-
211
-
212
-
213
-
214
-
215
-
216
-
217
-
218
-
219
-
220
-
221
-
222
-
223
-
224
-
225
-
226
-
227
-
228
-
229
-
230
-
231
-
232
-
233
-
234
-
235
-
236
-
237
-
238
-
239
-
240
-
241
-
242
-
243
-
244
-
245
-
246
-
247
-
248
-
249
-
250
 |
 |

75
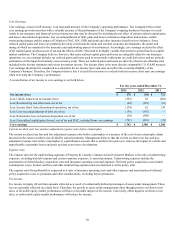
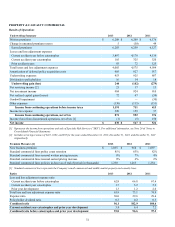
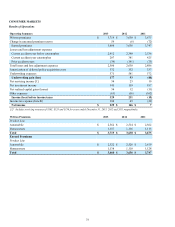
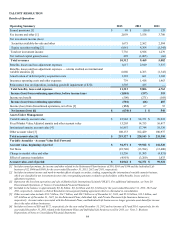
CONSUMER MARKETS
Results of Operations
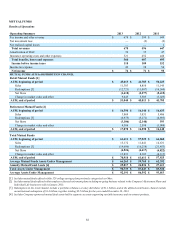
Operating Summary 2013 2012 2011
Written premiums $ 3,719 $ 3,630 $ 3,675
Change in unearned premium reserve 59 (6)(72)
Earned premiums 3,660 3,636 3,747
Losses and loss adjustment expenses
Current accident year before catastrophes 2,412 2,390 2,536
Current accident year catastrophes 207 381 425
Prior accident years (39)(141)(75)
Total losses and loss adjustment expenses 2,580 2,630 2,886
Amortization of deferred policy acquisition costs 332 332 337
Underwriting expenses 571 581 572
Underwriting gain (loss) 177 93 (48)
Net servicing income [1] 34 23 19
Net investment income 145 159 187
Net realized capital gains (losses) 34 12 (11)
Other expenses (61)(56)(162)
Income (loss) before income taxes 329 231 (15)
Income tax expense (benefit) 100 65 (22)
Net income $ 229 $ 166 $ 7
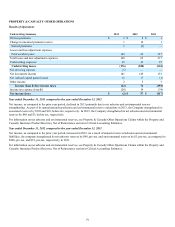
[1] Includes servicing revenues of $163, $155 and $156 for years ended December 31, 2013, 2012 and 2011 respectively.
Written Premiums 2013 2012 2011
Product Line
Automobile $ 2,562 $ 2,514 $ 2,562
Homeowners 1,157 1,116 1,113
Total $ 3,719 $ 3,630 $ 3,675
Earned Premiums
Product Line
Automobile $ 2,522 $ 2,526 $ 2,619
Homeowners 1,138 1,110 1,128
Total $ 3,660 $ 3,636 $ 3,747