The Hartford 2013 Annual Report Download - page 65
Download and view the complete annual report
Please find page 65 of the 2013 The Hartford annual report below. You can navigate through the pages in the report by either clicking on the pages listed below, or by using the keyword search tool below to find specific information within the annual report.-
 1
1 -
2
-
3
-
4
-
5
-
6
-
7
-
8
-
9
-
10
-
11
-
12
-
13
-
14
-
15
-
16
-
17
-
18
-
19
-
20
-
21
-
22
-
23
-
24
-
25
-
26
-
27
-
28
-
29
-
30
-
31
-
32
-
33
-
34
-
35
-
36
-
37
-
38
-
39
-
40
-
41
-
42
-
43
-
44
-
45
-
46
-
47
-
48
-
49
-
50
-
51
-
52
-
53
-
54
-
 55
55 -
 56
56 -
 57
57 -
 58
58 -
 59
59 -
 60
60 -
 61
61 -
 62
62 -
 63
63 -
 64
64 -
 65
65 -
 66
66 -
 67
67 -
 68
68 -
 69
69 -
 70
70 -
 71
71 -
 72
72 -
 73
73 -
 74
74 -
 75
75 -
76
-
77
-
78
-
79
-
80
-
81
-
82
-
83
-
84
-
85
-
86
-
87
-
88
-
89
-
90
-
91
-
92
-
93
-
94
-
95
-
96
-
97
-
98
-
99
-
100
-
101
-
102
-
103
-
104
-
105
-
106
-
107
-
108
-
109
-
110
-
111
-
112
-
113
-
114
-
115
-
116
-
117
-
118
-
119
-
120
-
121
-
122
-
123
-
124
-
125
-
126
-
127
-
128
-
129
-
130
-
131
-
132
-
133
-
134
-
135
-
136
-
137
-
138
-
139
-
140
-
141
-
142
-
143
-
144
-
145
-
146
-
147
-
148
-
149
-
150
-
151
-
152
-
153
-
154
-
155
-
156
-
157
-
158
-
159
-
160
-
161
-
162
-
163
-
164
-
165
-
166
-
167
-
168
-
169
-
170
-
171
-
172
-
173
-
174
-
175
-
176
-
177
-
178
-
179
-
180
-
181
-
182
-
183
-
184
-
185
-
186
-
187
-
188
-
189
-
190
-
191
-
192
-
193
-
194
-
195
-
196
-
197
-
198
-
199
-
200
-
201
-
202
-
203
-
204
-
205
-
206
-
207
-
208
-
209
-
210
-
211
-
212
-
213
-
214
-
215
-
216
-
217
-
218
-
219
-
220
-
221
-
222
-
223
-
224
-
225
-
226
-
227
-
228
-
229
-
230
-
231
-
232
-
233
-
234
-
235
-
236
-
237
-
238
-
239
-
240
-
241
-
242
-
243
-
244
-
245
-
246
-
247
-
248
-
249
-
250
 |
 |
65
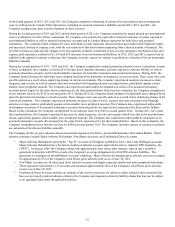
The annual goodwill assessment for the Mutual Funds, Group Benefits, and Consumer Markets reporting units was completed during the
fourth quarter of 2013, which resulted in no write-downs of goodwill for the year ended December 31, 2013. All reporting units passed
the first step of their annual impairment test with a significant margin.
For information on the results of goodwill impairment tests performed in 2012 and 2011 see Note 9 - Goodwill of Notes to Consolidated
Financial Statements.
Valuation of Investments and Derivative Instruments
Available-for-Sale Securities, Fixed Maturities, FVO, Equity Securities, Trading, and Short-term Investments
The fair value of AFS securities, fixed maturities at fair value using the fair value option (“FVO”), equity securities, trading, and short-
term investments in an active and orderly market (i.e., not distressed or forced liquidation) are determined by management after
considering one of three primary sources of information: third-party pricing services, independent broker quotations or pricing matrices.
Security pricing is applied using a “waterfall” approach whereby publicly available prices are first sought from third-party pricing
services, the remaining unpriced securities are submitted to independent brokers for prices, or lastly, securities are priced using a pricing
matrix. Typical inputs used by these pricing methods include, but are not limited to, reported trades, benchmark yields, issuer spreads,
bids, offers, and/or estimated cash flows, prepayments speeds and default rates. Based on the typical trading volumes and the lack of
quoted market prices for fixed maturities, third-party pricing services will normally derive the security prices through recent reported
trades for identical or similar securities making adjustments through the reporting date based upon available market observable
information as outlined above. If there are no recent reported trades, the third party pricing services and brokers may use matrix or
model processes to develop a security price where future cash flow expectations are developed based upon collateral performance and
discounted at an estimated market rate. Included in the pricing of asset-backed-securities ("ABS") and residential mortgage-backed
securities ("RMBS") are estimates of the rate of future prepayments of principal over the remaining life of the securities. Such estimates
are derived based on the characteristics of the underlying structure and prepayment speeds previously experienced at the interest rate
levels projected for the underlying collateral. Actual prepayment experience may vary from these estimates. For further discussion, see
the AFS Securities, Fixed Maturities, FVO, Equity Securities, Trading, and Short-Term Investments section in Note 5 of Notes to
Consolidated Financial Statements.
The Company has analyzed the third-party pricing services' valuation methodologies and related inputs, and has also evaluated the
various types of securities in its investment portfolio to determine an appropriate fair value hierarchy level based upon trading activity
and the observability of market inputs. For further discussion of fair value measurement, see Note 5 of Notes to Consolidated Financial
Statements.