The Hartford 2013 Annual Report Download - page 184
Download and view the complete annual report
Please find page 184 of the 2013 The Hartford annual report below. You can navigate through the pages in the report by either clicking on the pages listed below, or by using the keyword search tool below to find specific information within the annual report.-
 1
1 -
2
-
3
-
4
-
5
-
6
-
7
-
8
-
9
-
10
-
11
-
12
-
13
-
14
-
15
-
16
-
17
-
18
-
19
-
20
-
21
-
22
-
23
-
24
-
25
-
26
-
27
-
28
-
29
-
30
-
31
-
32
-
33
-
34
-
35
-
36
-
37
-
38
-
39
-
40
-
41
-
42
-
43
-
44
-
45
-
46
-
47
-
48
-
49
-
50
-
51
-
52
-
53
-
54
-
55
-
56
-
57
-
58
-
59
-
60
-
61
-
62
-
63
-
64
-
65
-
66
-
67
-
68
-
69
-
70
-
71
-
72
-
73
-
74
-
75
-
76
-
77
-
78
-
79
-
80
-
81
-
82
-
83
-
84
-
85
-
86
-
87
-
88
-
89
-
90
-
91
-
92
-
93
-
94
-
95
-
96
-
97
-
98
-
99
-
100
-
101
-
102
-
103
-
104
-
105
-
106
-
107
-
108
-
109
-
110
-
111
-
112
-
113
-
114
-
115
-
116
-
117
-
118
-
119
-
120
-
121
-
122
-
123
-
124
-
125
-
126
-
127
-
128
-
129
-
130
-
131
-
132
-
133
-
134
-
135
-
136
-
137
-
138
-
139
-
140
-
141
-
142
-
143
-
144
-
145
-
146
-
147
-
148
-
149
-
150
-
151
-
152
-
153
-
154
-
155
-
156
-
157
-
158
-
159
-
160
-
161
-
162
-
163
-
164
-
165
-
166
-
167
-
168
-
169
-
170
-
171
-
172
-
173
-
 174
174 -
 175
175 -
 176
176 -
 177
177 -
 178
178 -
 179
179 -
 180
180 -
 181
181 -
 182
182 -
 183
183 -
 184
184 -
 185
185 -
 186
186 -
 187
187 -
 188
188 -
 189
189 -
 190
190 -
 191
191 -
 192
192 -
 193
193 -
 194
194 -
195
-
196
-
197
-
198
-
199
-
200
-
201
-
202
-
203
-
204
-
205
-
206
-
207
-
208
-
209
-
210
-
211
-
212
-
213
-
214
-
215
-
216
-
217
-
218
-
219
-
220
-
221
-
222
-
223
-
224
-
225
-
226
-
227
-
228
-
229
-
230
-
231
-
232
-
233
-
234
-
235
-
236
-
237
-
238
-
239
-
240
-
241
-
242
-
243
-
244
-
245
-
246
-
247
-
248
-
249
-
250
 |
 |

F-48
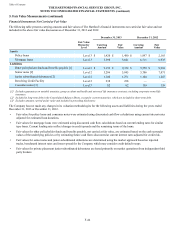
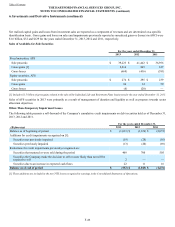
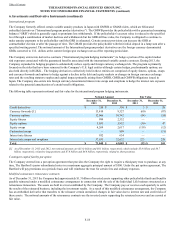
The Company's only exposure to any credit concentration risk of a single issuer greater than 10% of the Company's stockholders' equity,
other than the U.S. government and certain U.S. government securities, was the Government of Japan, which represents $2.6 billion and
$2.7 billion , or 14% and 12% of stockholders' equity, and 3% and 2% of total invested assets as of December 31, 2013 and 2012, respectively.
As of December 31, 2013, other than U.S. government and certain U.S. government agencies, the Company’s three largest exposures by
issuer were the Government of Japan, Goldman Sachs Group Inc., and State of Illinois which each comprised less than 4% of total invested
assets. As of December 31, 2012, other than U.S. government and certain U.S. government agencies, the Company’s three largest exposures
by issuer were the Government of Japan, State of California, and National Grid PLC which each comprised less than 3% of total invested
assets. The Company’s three largest exposures by sector as of December 31, 2013 were municipal securities, utilities, and financial services
which comprised approximately 15%, 8% and 7%, respectively, of total invested assets. The Company’s three largest exposures by sector
as of December 31, 2012 were municipal investments, utilities, and financial services which comprised approximately 7%, 6% and 5%,
respectively, of total invested assets.
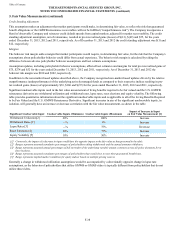
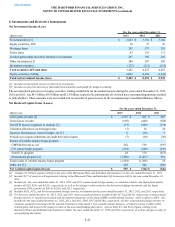
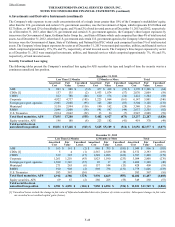
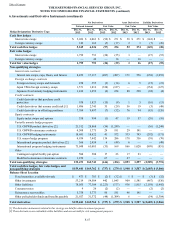
Security Unrealized Loss Aging
The following tables present the Company’s unrealized loss aging for AFS securities by type and length of time the security was in a
continuous unrealized loss position.
December 31, 2013
Less Than 12 Months 12 Months or More Total
Amortized
Cost Fair
Value Unrealized
Losses Amortized
Cost Fair
Value Unrealized
Losses Amortized
Cost Fair
Value Unrealized
Losses
ABS $ 893 $ 888 $ (5) $ 477 $ 418 $ (59) $ 1,370 $ 1,306 $ (64)
CDOs [1] 137 135 (2) 1,933 1,874 (57) 2,070 2,009 (59)
CMBS 812 788 (24) 610 576 (34) 1,422 1,364 (58)
Corporate 4,922 4,737 (185) 1,225 1,064 (161) 6,147 5,801 (346)
Foreign govt./govt. agencies 2,961 2,868 (93) 343 260 (83) 3,304 3,128 (176)
Municipal 3,150 2,994 (156) 190 162 (28) 3,340 3,156 (184)
RMBS 2,046 2,008 (38) 591 547 (44) 2,637 2,555 (82)
U.S. Treasuries 2,914 2,862 (52) 33 26 (7) 2,947 2,888 (59)
Total fixed maturities, AFS 17,835 17,280 (555) 5,402 4,927 (473) 23,237 22,207 (1,028)
Equity securities, AFS 196 188 (8) 223 182 (41) 419 370 (49)
Total securities in an
unrealized loss position $ 18,031 $ 17,468 $ (563) $ 5,625 $5,109 $ (514) $ 23,656 $22,577 $ (1,077)
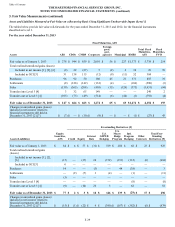
December 31, 2012
Less Than 12 Months 12 Months or More Total
Amortized
Cost Fair
Value Unrealized
Losses Amortized
Cost Fair
Value Unrealized
Losses Amortized
Cost Fair
Value Unrealized
Losses
ABS $ 163 $ 161 $ (2) $ 886 $ 705 $ (181) $ 1,049 $ 866 $ (183)
CDOs [1] 5 4 (1) 2,567 2,389 (158) 2,572 2,393 (159)
CMBS 339 322 (17) 1,248 1,086 (162) 1,587 1,408 (179)
Corporate 1,261 1,218 (43) 1,823 1,590 (233) 3,084 2,808 (276)
Foreign govt./govt. agencies 1,380 1,343 (37) 20 17 (3) 1,400 1,360 (40)
Municipal 271 265 (6) 157 144 (13) 428 409 (19)
RMBS 910 908 (2) 869 738 (131) 1,779 1,646 (133)
U.S. Treasuries 583 567 (16) — — — 583 567 (16)
Total fixed maturities, AFS 4,912 4,788 (124) 7,570 6,669 (881) 12,482 11,457 (1,005)
Equity securities, AFS 69 67 (2) 280 225 (55) 349 292 (57)
Total securities in an
unrealized loss position $ 4,981 $ 4,855 $ (126) $ 7,850 $ 6,894 $ (936) $ 12,831 $11,749 $ (1,062)
[1] Unrealized losses exclude the change in fair value of bifurcated embedded derivative features of certain securities. Subsequent changes in fair value
are recorded in net realized capital gains (losses).
Table of Contents THE HARTFORD FINANCIAL SERVICES GROUP, INC.
NOTES TO CONSOLIDATED FINANCIAL STATEMENTS (continued)
6. Investments and Derivative Instruments (continued)