The Hartford 2013 Annual Report Download - page 72
Download and view the complete annual report
Please find page 72 of the 2013 The Hartford annual report below. You can navigate through the pages in the report by either clicking on the pages listed below, or by using the keyword search tool below to find specific information within the annual report.-
 1
1 -
2
-
3
-
4
-
5
-
6
-
7
-
8
-
9
-
10
-
11
-
12
-
13
-
14
-
15
-
16
-
17
-
18
-
19
-
20
-
21
-
22
-
23
-
24
-
25
-
26
-
27
-
28
-
29
-
30
-
31
-
32
-
33
-
34
-
35
-
36
-
37
-
38
-
39
-
40
-
41
-
42
-
43
-
44
-
45
-
46
-
47
-
48
-
49
-
50
-
51
-
52
-
53
-
54
-
55
-
56
-
57
-
58
-
59
-
60
-
61
-
 62
62 -
 63
63 -
 64
64 -
 65
65 -
 66
66 -
 67
67 -
 68
68 -
 69
69 -
 70
70 -
 71
71 -
 72
72 -
 73
73 -
 74
74 -
 75
75 -
 76
76 -
 77
77 -
 78
78 -
 79
79 -
 80
80 -
 81
81 -
 82
82 -
83
-
84
-
85
-
86
-
87
-
88
-
89
-
90
-
91
-
92
-
93
-
94
-
95
-
96
-
97
-
98
-
99
-
100
-
101
-
102
-
103
-
104
-
105
-
106
-
107
-
108
-
109
-
110
-
111
-
112
-
113
-
114
-
115
-
116
-
117
-
118
-
119
-
120
-
121
-
122
-
123
-
124
-
125
-
126
-
127
-
128
-
129
-
130
-
131
-
132
-
133
-
134
-
135
-
136
-
137
-
138
-
139
-
140
-
141
-
142
-
143
-
144
-
145
-
146
-
147
-
148
-
149
-
150
-
151
-
152
-
153
-
154
-
155
-
156
-
157
-
158
-
159
-
160
-
161
-
162
-
163
-
164
-
165
-
166
-
167
-
168
-
169
-
170
-
171
-
172
-
173
-
174
-
175
-
176
-
177
-
178
-
179
-
180
-
181
-
182
-
183
-
184
-
185
-
186
-
187
-
188
-
189
-
190
-
191
-
192
-
193
-
194
-
195
-
196
-
197
-
198
-
199
-
200
-
201
-
202
-
203
-
204
-
205
-
206
-
207
-
208
-
209
-
210
-
211
-
212
-
213
-
214
-
215
-
216
-
217
-
218
-
219
-
220
-
221
-
222
-
223
-
224
-
225
-
226
-
227
-
228
-
229
-
230
-
231
-
232
-
233
-
234
-
235
-
236
-
237
-
238
-
239
-
240
-
241
-
242
-
243
-
244
-
245
-
246
-
247
-
248
-
249
-
250
 |
 |

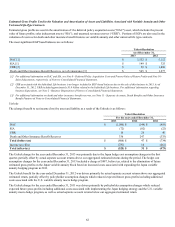
72
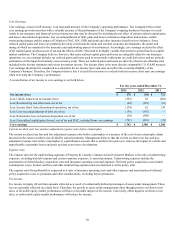
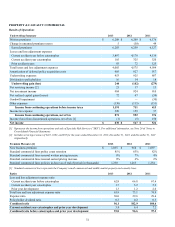
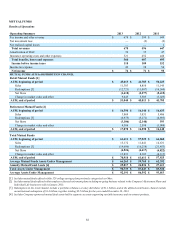
PROPERTY & CASUALTY COMMERCIAL
Results of Operations
Underwriting Summary 2013 2012 2011
Written premiums $ 6,208 $ 6,209 $ 6,176
Change in unearned premium reserve 5 (50) 49
Earned premiums 6,203 6,259 6,127
Losses and loss adjustment expenses
Current accident year before catastrophes 3,897 4,178 4,139
Current accident year catastrophes 105 325 320
Prior accident years 83 72 125
Total losses and loss adjustment expenses 4,085 4,575 4,584
Amortization of deferred policy acquisition costs 905 927 917
Underwriting expenses 953 925 887
Dividends to policyholders 16 14 18
Underwriting gain (loss) 244 (182) (279)
Net servicing income [2] 21 17 13
Net investment income 984 924 910
Net realized capital gains (losses) 72 67 (50)
Goodwill impairment — — (30)
Other expenses (130)(115) (151)
Income from continuing operations before income taxes 1,191 711 413
Income tax expense 320 159 37
Income from continuing operations, net of tax 871 552 376
Income (loss) from discontinued operations, net of tax [1] (1)(5) 150
Net income $ 870 $ 547 $ 526
[1] Represents the income from operations and sale of Specialty Risk Services (“SRS”). For additional information, see Note 20 of Notes to
Consolidated Financial Statements.
[2] Includes servicing revenues of $112, $102, and $97 for the years ended December 31, 2013, December 31, 2012, and December 31, 2011
respectively.
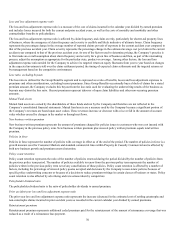
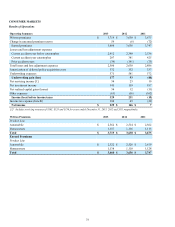
Premium Measures [1] 2013 2012 2011
New business premium $ 1,035 $ 968 $ 1,097
Standard commercial lines policy count retention 81% 83% 82%
Standard commercial lines renewal written pricing increase 8% 7% 4%
Standard commercial lines renewal earned pricing increase 8% 6% 2%
Standard commercial lines policies in-force as of end of period (in thousands) 1,250 1,263 1,254
[1] Standard commercial lines represents the Company’s small commercial and middle market property and casualty lines.
Ratios 2013 2012 2011
Loss and loss adjustment expense ratio
Current accident year before catastrophes 62.8 66.8 67.6
Current accident year catastrophes 1.7 5.2 5.2
Prior year development 1.3 1.2 2.0
Total loss and loss adjustment expense ratio 65.9 73.1 74.8
Expense ratio 30.0 29.6 29.4
Policyholder dividend ratio 0.3 0.2 0.3
Combined ratio 96.1 102.9 104.6
Current accident year catastrophes and prior year development 3.0 6.4 7.2
Combined ratio before catastrophes and prior year development 93.0 96.6 97.3