The Hartford 2013 Annual Report Download - page 64
Download and view the complete annual report
Please find page 64 of the 2013 The Hartford annual report below. You can navigate through the pages in the report by either clicking on the pages listed below, or by using the keyword search tool below to find specific information within the annual report.-
 1
1 -
2
-
3
-
4
-
5
-
6
-
7
-
8
-
9
-
10
-
11
-
12
-
13
-
14
-
15
-
16
-
17
-
18
-
19
-
20
-
21
-
22
-
23
-
24
-
25
-
26
-
27
-
28
-
29
-
30
-
31
-
32
-
33
-
34
-
35
-
36
-
37
-
38
-
39
-
40
-
41
-
42
-
43
-
44
-
45
-
46
-
47
-
48
-
49
-
50
-
51
-
52
-
53
-
 54
54 -
 55
55 -
 56
56 -
 57
57 -
 58
58 -
 59
59 -
 60
60 -
 61
61 -
 62
62 -
 63
63 -
 64
64 -
 65
65 -
 66
66 -
 67
67 -
 68
68 -
 69
69 -
 70
70 -
 71
71 -
 72
72 -
 73
73 -
 74
74 -
75
-
76
-
77
-
78
-
79
-
80
-
81
-
82
-
83
-
84
-
85
-
86
-
87
-
88
-
89
-
90
-
91
-
92
-
93
-
94
-
95
-
96
-
97
-
98
-
99
-
100
-
101
-
102
-
103
-
104
-
105
-
106
-
107
-
108
-
109
-
110
-
111
-
112
-
113
-
114
-
115
-
116
-
117
-
118
-
119
-
120
-
121
-
122
-
123
-
124
-
125
-
126
-
127
-
128
-
129
-
130
-
131
-
132
-
133
-
134
-
135
-
136
-
137
-
138
-
139
-
140
-
141
-
142
-
143
-
144
-
145
-
146
-
147
-
148
-
149
-
150
-
151
-
152
-
153
-
154
-
155
-
156
-
157
-
158
-
159
-
160
-
161
-
162
-
163
-
164
-
165
-
166
-
167
-
168
-
169
-
170
-
171
-
172
-
173
-
174
-
175
-
176
-
177
-
178
-
179
-
180
-
181
-
182
-
183
-
184
-
185
-
186
-
187
-
188
-
189
-
190
-
191
-
192
-
193
-
194
-
195
-
196
-
197
-
198
-
199
-
200
-
201
-
202
-
203
-
204
-
205
-
206
-
207
-
208
-
209
-
210
-
211
-
212
-
213
-
214
-
215
-
216
-
217
-
218
-
219
-
220
-
221
-
222
-
223
-
224
-
225
-
226
-
227
-
228
-
229
-
230
-
231
-
232
-
233
-
234
-
235
-
236
-
237
-
238
-
239
-
240
-
241
-
242
-
243
-
244
-
245
-
246
-
247
-
248
-
249
-
250
 |
 |

64
Living Benefits Required to be Fair Valued (in Other Policyholder Funds and Benefits Payable)
Fair values for GMWB and GMAB contracts are calculated using the income approach based upon internally developed models because
active, observable markets do not exist for those items. The fair value of the Company’s guaranteed benefit liabilities, classified as
embedded derivatives, and the related reinsurance and customized freestanding derivatives is calculated as an aggregation of the
following components: Best Estimate Claims Payments; Credit Standing Adjustment; and Margins. The resulting aggregation is
reconciled or calibrated, if necessary, to market information that is, or may be, available to the Company, but may not be observable by
other market participants, including reinsurance discussions and transactions. The Company believes the aggregation of these
components, as necessary and as reconciled or calibrated to the market information available to the Company, results in an amount that
the Company would be required to transfer, or receive, for an asset, to or from market participants in an active liquid market, if one
existed, for those market participants to assume the risks associated with the guaranteed minimum benefits and the related reinsurance
and customized derivatives. The fair value is likely to materially diverge from the ultimate settlement of the liability as the Company
believes settlement will be based on our best estimate assumptions rather than those best estimate assumptions plus risk margins. In the
absence of any transfer of the guaranteed benefit liability to a third party, the release of risk margins is likely to be reflected as realized
gains in future periods’ net income. For further discussion on the impact of fair value changes from living benefits see Note 5 - Fair
Value Measurements of Notes to Consolidated Financial Statements and for a discussion on the sensitivities of certain living benefits due
to capital market factors see Variable Product Guarantee Risks and Risk Management section of the MD&A.
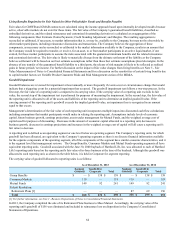
Goodwill Impairment
Goodwill balances are reviewed for impairment at least annually or more frequently if events occur or circumstances change that would
indicate that a triggering event for a potential impairment has occurred. The goodwill impairment test follows a two-step process. In the
first step, the fair value of a reporting unit is compared to its carrying value. If the carrying value of a reporting unit exceeds its fair
value, the second step of the impairment test is performed for purposes of measuring the impairment. In the second step, the fair value of
the reporting unit is allocated to all of the assets and liabilities of the reporting unit to determine an implied goodwill value. If the
carrying amount of the reporting unit’s goodwill exceeds the implied goodwill value, an impairment loss is recognized in an amount
equal to that excess.
Management’s determination of the fair value of each reporting unit incorporates multiple inputs into discounted cash flow calculations
including assumptions that market participants would make in valuing the reporting unit. Assumptions include levels of economic
capital, future business growth, earnings projections, assets under management for Mutual Funds, and the weighted average cost of
capital used for purposes of discounting. Decreases in the amount of economic capital allocated to a reporting unit, decreases in
business growth, decreases in earnings projections and increases in the weighted average cost of capital will all cause a reporting unit’s
fair value to decrease.
A reporting unit is defined as an operating segment or one level below an operating segment. The Company’s reporting units, for which
goodwill has been allocated, are equivalent to the Company’s operating segments as there is no discrete financial information available
for the separate components of the operating segment, all of the components of the segment have similar economic characteristics, and it
is the segment level that management reviews. The Group Benefits, Consumer Markets and Mutual Funds operating segments all have
equivalent reporting units. Goodwill associated with the June 30, 2000 buyback of Hartford Life, Inc. was allocated to each of Hartford
Life’s reporting units based on the reporting unit's fair value of in-force business at the time of the buyback. Although this goodwill was
allocated to each reporting unit, as shown in the table below, it is held in Corporate for segment reporting.
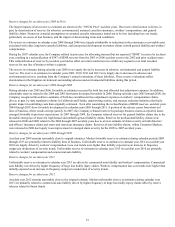
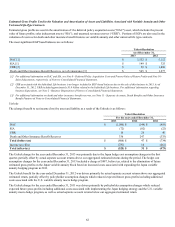
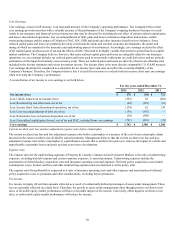
The carrying value of goodwill allocated to reporting units is as follows:
As of December 31, 2013 As of December 31, 2012
Segment
Goodwill Goodwill in
Corporate Total Segment
Goodwill Goodwill in
Corporate Total
Group Benefits $ — $ 138 $ 138 $ — $ 138 $ 138
Consumer Markets 119 — 119 119 — 119
Mutual Funds 149 92 241 149 92 241
Talcott Resolution:
Retirement Plans [1] — — — 87 69 156
Total $ 268 $ 230 $ 498 $ 355 $ 299 $ 654
[1] For further information, see Note 2 - Business Dispositions of Notes to Consolidated Financial Statements.
In 2013, the Company completed the sale of its Retirement Plans business to Mass Mutual. Accordingly, the carrying value of the
reporting unit's goodwill of $156 was eliminated and included in reinsurance loss on disposition in the Company's Consolidated
Statements of Operations.