The Hartford 2013 Annual Report Download - page 69
Download and view the complete annual report
Please find page 69 of the 2013 The Hartford annual report below. You can navigate through the pages in the report by either clicking on the pages listed below, or by using the keyword search tool below to find specific information within the annual report.-
 1
1 -
2
-
3
-
4
-
5
-
6
-
7
-
8
-
9
-
10
-
11
-
12
-
13
-
14
-
15
-
16
-
17
-
18
-
19
-
20
-
21
-
22
-
23
-
24
-
25
-
26
-
27
-
28
-
29
-
30
-
31
-
32
-
33
-
34
-
35
-
36
-
37
-
38
-
39
-
40
-
41
-
42
-
43
-
44
-
45
-
46
-
47
-
48
-
49
-
50
-
51
-
52
-
53
-
54
-
55
-
56
-
57
-
58
-
 59
59 -
 60
60 -
 61
61 -
 62
62 -
 63
63 -
 64
64 -
 65
65 -
 66
66 -
 67
67 -
 68
68 -
 69
69 -
 70
70 -
 71
71 -
 72
72 -
 73
73 -
 74
74 -
 75
75 -
 76
76 -
 77
77 -
 78
78 -
 79
79 -
80
-
81
-
82
-
83
-
84
-
85
-
86
-
87
-
88
-
89
-
90
-
91
-
92
-
93
-
94
-
95
-
96
-
97
-
98
-
99
-
100
-
101
-
102
-
103
-
104
-
105
-
106
-
107
-
108
-
109
-
110
-
111
-
112
-
113
-
114
-
115
-
116
-
117
-
118
-
119
-
120
-
121
-
122
-
123
-
124
-
125
-
126
-
127
-
128
-
129
-
130
-
131
-
132
-
133
-
134
-
135
-
136
-
137
-
138
-
139
-
140
-
141
-
142
-
143
-
144
-
145
-
146
-
147
-
148
-
149
-
150
-
151
-
152
-
153
-
154
-
155
-
156
-
157
-
158
-
159
-
160
-
161
-
162
-
163
-
164
-
165
-
166
-
167
-
168
-
169
-
170
-
171
-
172
-
173
-
174
-
175
-
176
-
177
-
178
-
179
-
180
-
181
-
182
-
183
-
184
-
185
-
186
-
187
-
188
-
189
-
190
-
191
-
192
-
193
-
194
-
195
-
196
-
197
-
198
-
199
-
200
-
201
-
202
-
203
-
204
-
205
-
206
-
207
-
208
-
209
-
210
-
211
-
212
-
213
-
214
-
215
-
216
-
217
-
218
-
219
-
220
-
221
-
222
-
223
-
224
-
225
-
226
-
227
-
228
-
229
-
230
-
231
-
232
-
233
-
234
-
235
-
236
-
237
-
238
-
239
-
240
-
241
-
242
-
243
-
244
-
245
-
246
-
247
-
248
-
249
-
250
 |
 |

69
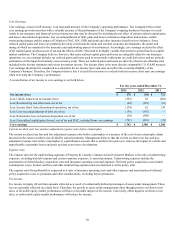
Core Earnings
Core earnings, a non-GAAP measure, is an important measure of the Company’s operating performance. The Company believes that
core earnings provides investors with a valuable measure of the performance of the Company’s ongoing businesses because it reveals
trends in our insurance and financial services businesses that may be obscured by including the net effect of certain realized capital gains
and losses, discontinued operations, loss on extinguishment of debt, gains and losses on business disposition transactions, certain
restructuring charges and the impact of Unlocks to DAC, SIA, URR and death and other insurance benefit reserve balances. Some
realized capital gains and losses are primarily driven by investment decisions and external economic developments, the nature and
timing of which are unrelated to the insurance and underwriting aspects of our business. Accordingly, core earnings excludes the effect
of all realized gains and losses (net of tax and the effects of DAC) that tend to be highly variable from period to period based on capital
market conditions. The Company believes, however, that some realized capital gains and losses are integrally related to our insurance
operations, so core earnings includes net realized gains and losses such as net periodic settlements on credit derivatives and net periodic
settlements on the Japan fixed annuity cross-currency swap. These net realized gains and losses are directly related to an offsetting item
included in the income statement such as net investment income. Net income (loss) is the most directly comparable U.S. GAAP measure.
Core earnings should not be considered as a substitute for net income (loss) and does not reflect the overall profitability of the
Company’s business. Therefore, the Company believes that it is useful for investors to evaluate both net income (loss) and core earnings
when reviewing the Company’s performance.
A reconciliation of net income to core earnings is set forth below:
For the years ended December 31,
2013 2012 2011
Net income (loss) $ 176 $ (38) $ 712
Less: Unlock impacts on net income (loss) (525) 28 (481)
Less: Restructuring and other costs, net of tax (44)(129) (16)
Less: Income (loss) from discontinued operations, net of tax (134) 62 139
Less: Loss on extinguishment of debt, net of tax (138)(587) —
Less: Reinsurance loss on business disposition, net of tax (24)(388) —
Less: Net realized capital gains (losses), net of tax and DAC, excluded from core earnings (701)(410) (38)
Core earnings $ 1,742 $ 1,386 $ 1,108
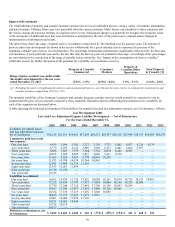
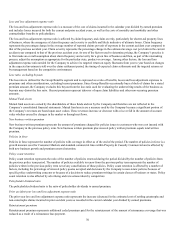
Current accident year loss and loss adjustment expense ratio before catastrophes
The current accident year loss and loss adjustment expense ratio before catastrophes is a measure of the cost of non-catastrophe claims
incurred in the current accident year divided by earned premiums. Management believes that the current accident year loss and loss
adjustment expense ratio before catastrophes is a performance measure that is useful to investors as it removes the impact of volatile and
unpredictable catastrophe losses and prior accident year reserve development.
Expense ratio
The expense ratio for the underwriting segments of Property & Casualty Commercial and Consumer Markets is the ratio of underwriting
expenses, excluding bad debt expense and certain corporate expenses, to earned premiums. Underwriting expenses include the
amortization of deferred policy acquisition costs and insurance operating costs and expenses. Deferred policy acquisition costs include
commissions, taxes, licenses and fees and other underwriting expenses and are amortized over the policy term.
The expense ratio Group Benefits is expressed as a ratio of insurance operating costs and other expenses and amortization of deferred
policy acquisition costs, to premiums and other considerations, excluding buyout premiums.
Fee Income
Fee income is largely driven from amounts collected as a result of contractually defined percentages of assets under management. These
fees are generally collected on a daily basis. Therefore, the growth in assets under management either through positive net flows or net
sales, or favorable equity market performance will have a favorable impact on fee income. Conversely, either negative net flows or net
sales, or unfavorable equity market performance will reduce fee income.