The Hartford 2013 Annual Report Download - page 141
Download and view the complete annual report
Please find page 141 of the 2013 The Hartford annual report below. You can navigate through the pages in the report by either clicking on the pages listed below, or by using the keyword search tool below to find specific information within the annual report.-
 1
1 -
2
-
3
-
4
-
5
-
6
-
7
-
8
-
9
-
10
-
11
-
12
-
13
-
14
-
15
-
16
-
17
-
18
-
19
-
20
-
21
-
22
-
23
-
24
-
25
-
26
-
27
-
28
-
29
-
30
-
31
-
32
-
33
-
34
-
35
-
36
-
37
-
38
-
39
-
40
-
41
-
42
-
43
-
44
-
45
-
46
-
47
-
48
-
49
-
50
-
51
-
52
-
53
-
54
-
55
-
56
-
57
-
58
-
59
-
60
-
61
-
62
-
63
-
64
-
65
-
66
-
67
-
68
-
69
-
70
-
71
-
72
-
73
-
74
-
75
-
76
-
77
-
78
-
79
-
80
-
81
-
82
-
83
-
84
-
85
-
86
-
87
-
88
-
89
-
90
-
91
-
92
-
93
-
94
-
95
-
96
-
97
-
98
-
99
-
100
-
101
-
102
-
103
-
104
-
105
-
106
-
107
-
108
-
109
-
110
-
111
-
112
-
113
-
114
-
115
-
116
-
117
-
118
-
119
-
120
-
121
-
122
-
123
-
124
-
125
-
126
-
127
-
128
-
129
-
130
-
 131
131 -
 132
132 -
 133
133 -
 134
134 -
 135
135 -
 136
136 -
 137
137 -
 138
138 -
 139
139 -
 140
140 -
 141
141 -
 142
142 -
 143
143 -
 144
144 -
 145
145 -
 146
146 -
 147
147 -
 148
148 -
 149
149 -
 150
150 -
 151
151 -
152
-
153
-
154
-
155
-
156
-
157
-
158
-
159
-
160
-
161
-
162
-
163
-
164
-
165
-
166
-
167
-
168
-
169
-
170
-
171
-
172
-
173
-
174
-
175
-
176
-
177
-
178
-
179
-
180
-
181
-
182
-
183
-
184
-
185
-
186
-
187
-
188
-
189
-
190
-
191
-
192
-
193
-
194
-
195
-
196
-
197
-
198
-
199
-
200
-
201
-
202
-
203
-
204
-
205
-
206
-
207
-
208
-
209
-
210
-
211
-
212
-
213
-
214
-
215
-
216
-
217
-
218
-
219
-
220
-
221
-
222
-
223
-
224
-
225
-
226
-
227
-
228
-
229
-
230
-
231
-
232
-
233
-
234
-
235
-
236
-
237
-
238
-
239
-
240
-
241
-
242
-
243
-
244
-
245
-
246
-
247
-
248
-
249
-
250
 |
 |

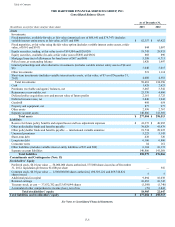
F-5
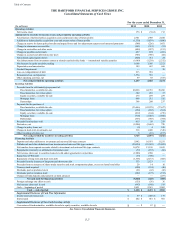
As of December 31,
(In millions, except for share and per share data) 2013 2012
Assets
Investments:
Fixed maturities, available-for-sale, at fair value (amortized cost of $60,641 and $79,747) (includes
variable interest entity assets, at fair value, of $31 and $89) $ 62,357 $ 85,922
Fixed maturities, at fair value using the fair value option (includes variable interest entity assets, at fair
value, of $161 and $163) 844 1,087
Equity securities, trading, at fair value (cost of $14,504 and $26,820) 19,745 28,933
Equity securities, available-for-sale, at fair value (cost of $850 and $866) 868 890
Mortgage loans (net of allowances for loan losses of $67 and $68) 5,598 6,711
Policy loans, at outstanding balance 1,420 1,997
Limited partnerships and other alternative investments (includes variable interest entity assets of $4 and
$6) 3,040 3,015
Other investments 521 1,114
Short-term investments (includes variable interest entity assets, at fair value, of $3 as of December 31,
2013) 4,008 4,581
Total investments 98,401 134,250
Cash 1,428 2,421
Premiums receivable and agents’ balances, net 3,465 3,542
Reinsurance recoverables, net 23,330 4,666
Deferred policy acquisition costs and present value of future profits 2,161 5,725
Deferred income taxes, net 3,840 1,942
Goodwill 498 654
Property and equipment, net 877 977
Other assets 2,998 2,767
Separate account assets 140,886 141,569
Total assets $ 277,884 $ 298,513
Liabilities
Reserve for future policy benefits and unpaid losses and loss adjustment expenses $ 41,373 $ 40,992
Other policyholder funds and benefits payable 39,029 41,979
Other policyholder funds and benefits payable — international variable annuities 19,734 28,922
Unearned premiums 5,225 5,145
Short-term debt 438 320
Long-term debt 6,106 6,806
Consumer notes 84 161
Other liabilities (includes variable interest entity liabilities of $33 and $89) 6,104 10,172
Separate account liabilities 140,886 141,569
Total liabilities 258,979 276,066
Commitments and Contingencies (Note 13)
Stockholders’ Equity
Preferred stock, $0.01 par value — 50,000,000 shares authorized, 575,000 shares issued as of December
31, 2012, liquidation preference $1,000 per share — 556
Common stock, $0.01 par value — 1,500,000,000 shares authorized, 490,923,222 and 469,744,822
shares issued 5 5
Additional paid-in capital 9,894 10,038
Retained earnings 10,683 10,745
Treasury stock, at cost — 37,632,782 and 33,439,044 shares (1,598) (1,740)
Accumulated other comprehensive income (loss), net of tax (79) 2,843
Total stockholders’ equity 18,905 22,447
Total liabilities and stockholders’ equity $ 277,884 $ 298,513
See Notes to Consolidated Financial Statements.
Table of Contents
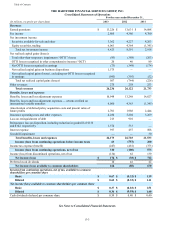
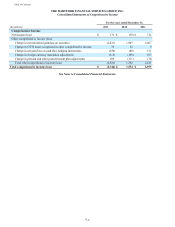
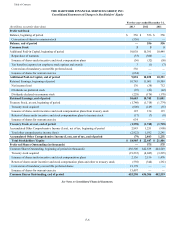
THE HARTFORD FINANCIAL SERVICES GROUP, INC.
Consolidated Balance Sheets