The Hartford 2013 Annual Report Download - page 58
Download and view the complete annual report
Please find page 58 of the 2013 The Hartford annual report below. You can navigate through the pages in the report by either clicking on the pages listed below, or by using the keyword search tool below to find specific information within the annual report.-
 1
1 -
2
-
3
-
4
-
5
-
6
-
7
-
8
-
9
-
10
-
11
-
12
-
13
-
14
-
15
-
16
-
17
-
18
-
19
-
20
-
21
-
22
-
23
-
24
-
25
-
26
-
27
-
28
-
29
-
30
-
31
-
32
-
33
-
34
-
35
-
36
-
37
-
38
-
39
-
40
-
41
-
42
-
43
-
44
-
45
-
46
-
47
-
 48
48 -
 49
49 -
 50
50 -
 51
51 -
 52
52 -
 53
53 -
 54
54 -
 55
55 -
 56
56 -
 57
57 -
 58
58 -
 59
59 -
 60
60 -
 61
61 -
 62
62 -
 63
63 -
 64
64 -
 65
65 -
 66
66 -
 67
67 -
 68
68 -
69
-
70
-
71
-
72
-
73
-
74
-
75
-
76
-
77
-
78
-
79
-
80
-
81
-
82
-
83
-
84
-
85
-
86
-
87
-
88
-
89
-
90
-
91
-
92
-
93
-
94
-
95
-
96
-
97
-
98
-
99
-
100
-
101
-
102
-
103
-
104
-
105
-
106
-
107
-
108
-
109
-
110
-
111
-
112
-
113
-
114
-
115
-
116
-
117
-
118
-
119
-
120
-
121
-
122
-
123
-
124
-
125
-
126
-
127
-
128
-
129
-
130
-
131
-
132
-
133
-
134
-
135
-
136
-
137
-
138
-
139
-
140
-
141
-
142
-
143
-
144
-
145
-
146
-
147
-
148
-
149
-
150
-
151
-
152
-
153
-
154
-
155
-
156
-
157
-
158
-
159
-
160
-
161
-
162
-
163
-
164
-
165
-
166
-
167
-
168
-
169
-
170
-
171
-
172
-
173
-
174
-
175
-
176
-
177
-
178
-
179
-
180
-
181
-
182
-
183
-
184
-
185
-
186
-
187
-
188
-
189
-
190
-
191
-
192
-
193
-
194
-
195
-
196
-
197
-
198
-
199
-
200
-
201
-
202
-
203
-
204
-
205
-
206
-
207
-
208
-
209
-
210
-
211
-
212
-
213
-
214
-
215
-
216
-
217
-
218
-
219
-
220
-
221
-
222
-
223
-
224
-
225
-
226
-
227
-
228
-
229
-
230
-
231
-
232
-
233
-
234
-
235
-
236
-
237
-
238
-
239
-
240
-
241
-
242
-
243
-
244
-
245
-
246
-
247
-
248
-
249
-
250
 |
 |

58
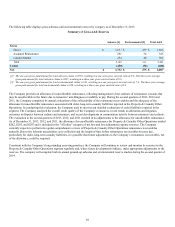
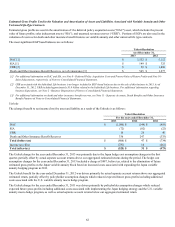
The following table displays gross asbestos and environmental reserves by category as of December 31, 2013:
Summary of Gross A&E Reserves
Asbestos [1] Environmental [2] Total A&E
Gross
Direct $ 1,637 $ 229 $ 1,866
Assumed Reinsurance 291 34 325
London Market 254 48 302
Total 2,182 311 2,493
Ceded (450)(36) (486)
Net $ 1,732 $ 275 $ 2,007
[1] The one year gross paid amount for total asbestos claims is $253, resulting in a one year gross survival ratio of 8.6. The three year average
gross paid amount for total asbestos claims is $247, resulting in a three year gross survival ratio of 8.8.
[2] The one year gross paid amount for total environmental claims is $41, resulting in a one year gross survival ratio of 7.6. The three year average
gross paid amount for total environmental claims is $50, resulting in a three year gross survival ratio of 6.3.
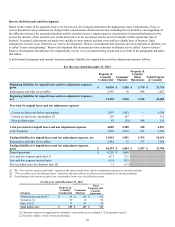
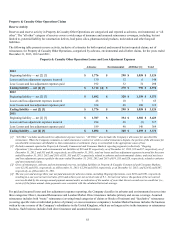
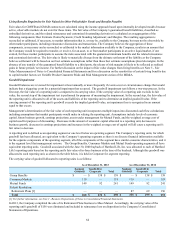
The Company provides an allowance for uncollectible reinsurance, reflecting management’s best estimate of reinsurance cessions that
may be uncollectible in the future due to reinsurers’ unwillingness or inability to pay. During the second quarters of 2013, 2012 and
2011, the Company completed its annual evaluations of the collectability of the reinsurance recoverables and the adequacy of the
allowance for uncollectible reinsurance associated with older, long-term casualty liabilities reported in the Property & Casualty Other
Operations. In conducting this evaluation, the Company used its most recent detailed evaluations of ceded liabilities reported in the
segment. The Company analyzed the overall credit quality of the Company’s reinsurers, recent trends in arbitration and litigation
outcomes in disputes between cedants and reinsurers, and recent developments in commutation activity between reinsurers and cedants.
The evaluation in the second quarters of 2013, 2012, and 2011 resulted in no adjustments to the allowance for uncollectible reinsurance.
As of December 31, 2013, 2012, and 2011, the allowance for uncollectible reinsurance for Property & Casualty Other Operations totaled
$202, $203, and $207 and is included in the "All other" category of net loss and loss adjustment expense reserves. The Company
currently expects to perform its regular comprehensive review of Property & Casualty Other Operations reinsurance recoverables
annually. Due to the inherent uncertainties as to collection and the length of time before reinsurance recoverables become due,
particularly for older, long-term casualty liabilities, it is possible that future adjustments to the Company’s reinsurance recoverables, net
of the allowance, could be required.
Consistent with the Company’s long-standing reserving practices, the Company will continue to review and monitor its reserves in the
Property & Casualty Other Operations segment regularly and, where future developments indicate, make appropriate adjustments to the
reserves. The company will complete both its annual ground-up asbestos and environmental reserve studies during the second quarter of
2014.