The Hartford 2013 Annual Report Download - page 113
Download and view the complete annual report
Please find page 113 of the 2013 The Hartford annual report below. You can navigate through the pages in the report by either clicking on the pages listed below, or by using the keyword search tool below to find specific information within the annual report.
113
In addition to the credit risk associated with the investment portfolio, the Company has $236 of reinsurance recoverables due from legal
entity counterparties domiciled within Europe. For a more detail discussion of the Company's reinsurance arrangements, see Note 7 of
Notes to the Consolidated Financial Statements.
Included in the Company’s equity securities, trading, portfolio are investments in World Government Bond Index Funds (“WGBI
funds”). The fair value of the WGBI funds at December 31, 2013 and 2012 was $7.6 billion and $11.8 billion, respectively. Because
several of these funds are managed by third party asset managers, the Company does not have access to detailed holdings; however, the
WGBI funds' investment mandate follows the Citigroup non-Japan World Government Fund Index (“the index”) and includes
allocations to certain European sovereign debt. The estimated fair value of the European allocation based upon the index benchmark
allocation was $3.3 billion and $5.0 billion as of December 31, 2013 and 2012, respectively. Included in this estimated European
exposure were investments in Ireland, Italy, Portugal and Spain with an estimated fair value of $1.2 billion and $1.6 billion as of
December 31, 2013 and 2012, respectively. The index guidelines allow investment in issuers rated BBB- or higher by Standard and
Poor's or Baa3 or higher by Moody's. Should an issuer’s credit rating fall below both of these rating levels they will be removed from the
Index and the holdings will be liquidated. Because these assets support the international variable annuity business, changes in the value
of these investments are reflected in the corresponding policyholder liabilities. The Company’s indirect exposure to these holdings is
through any guarantees issued on the underlying variable annuity policies. The Company has also entered into credit default swaps with
a notional amount and fair value of $350 and $5 , respectively, to hedge certain sovereign credit risks.
Emerging Market Exposure
Emerging market securities have been negatively impacted due to softer-than-expected economic growth as well as trade and budget
deficits raising the potential for destabilizing capital outflows and rapid currency depreciation, causing bondholders to demand a higher
yield which would depress the fair value of securities held. We expect continued sensitivity to the ongoing evolution of Fed policy and
other economic and political factors, including contagion risk.
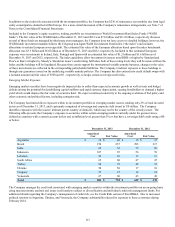
The Company has limited direct exposure within its investment portfolio to emerging market issuers, totaling only 2% of total invested
assets as of December 31, 2013, and is primarily comprised of sovereign and corporate debt issued in US dollars. The Company
identifies exposures with the issuers’ ultimate parent country of domicile, which may not be the country of the security issuer. The
following table presents the Company’s exposure to securities within certain emerging markets currently under the greatest stress,
defined as countries with a current account deficit and an inflation level greater than 5% or that have a sovereign S&P credit rating of B-
or below.
December 31, 2013 December 31, 2012
Amortized
Cost Fair Value Amortized
Cost Fair Value
Argentina $ 38 $ 40 $ 15 $ 15
Brazil 274 257 295 317
India 62 62 79 86
Indonesia 107 93 56 59
Lebanon 26 26 13 13
South Africa 65 60 47 47
Turkey 88 79 48 52
Ukraine 50 50 17 18
Uruguay 27 25 14 14
Venezuela 67 60 45 49
Total $ 804 $ 752 $ 629 $ 670
The Company manages the credit risk associated with emerging market securities within the investment portfolio on an on-going basis
using macroeconomic analysis and issuer credit analysis subject to diversification and individual credit risk management limits. For
additional details regarding the Company’s management of credit risk, see the Credit Risk section of this MD&A. Due to increased
political tensions in Argentina, Ukraine, and Venezuela, the Company substantially reduced its exposure to these economies during
February 2014.


