HSBC 2014 Annual Report Download - page 82
Download and view the complete annual report
Please find page 82 of the 2014 HSBC annual report below. You can navigate through the pages in the report by either clicking on the pages listed below, or by using the keyword search tool below to find specific information within the annual report.-
 1
1 -
2
-
3
-
4
-
5
-
6
-
7
-
8
-
9
-
10
-
11
-
12
-
13
-
14
-
15
-
16
-
17
-
18
-
19
-
20
-
21
-
22
-
23
-
24
-
25
-
26
-
27
-
28
-
29
-
30
-
31
-
32
-
33
-
34
-
35
-
36
-
37
-
38
-
39
-
40
-
41
-
42
-
43
-
44
-
45
-
46
-
47
-
48
-
49
-
50
-
51
-
52
-
53
-
54
-
55
-
56
-
57
-
58
-
59
-
60
-
61
-
62
-
63
-
64
-
65
-
66
-
67
-
68
-
69
-
70
-
71
-
 72
72 -
 73
73 -
 74
74 -
 75
75 -
 76
76 -
 77
77 -
 78
78 -
 79
79 -
 80
80 -
 81
81 -
 82
82 -
 83
83 -
 84
84 -
 85
85 -
 86
86 -
 87
87 -
 88
88 -
 89
89 -
 90
90 -
 91
91 -
 92
92 -
93
-
94
-
95
-
96
-
97
-
98
-
99
-
100
-
101
-
102
-
103
-
104
-
105
-
106
-
107
-
108
-
109
-
110
-
111
-
112
-
113
-
114
-
115
-
116
-
117
-
118
-
119
-
120
-
121
-
122
-
123
-
124
-
125
-
126
-
127
-
128
-
129
-
130
-
131
-
132
-
133
-
134
-
135
-
136
-
137
-
138
-
139
-
140
-
141
-
142
-
143
-
144
-
145
-
146
-
147
-
148
-
149
-
150
-
151
-
152
-
153
-
154
-
155
-
156
-
157
-
158
-
159
-
160
-
161
-
162
-
163
-
164
-
165
-
166
-
167
-
168
-
169
-
170
-
171
-
172
-
173
-
174
-
175
-
176
-
177
-
178
-
179
-
180
-
181
-
182
-
183
-
184
-
185
-
186
-
187
-
188
-
189
-
190
-
191
-
192
-
193
-
194
-
195
-
196
-
197
-
198
-
199
-
200
 |
 |
HSBC BANK PLC
Report of the Directors: Risk (continued)
80
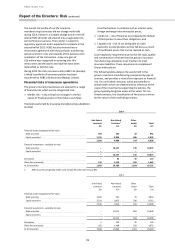
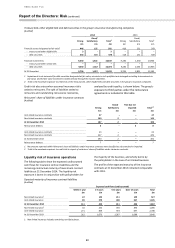
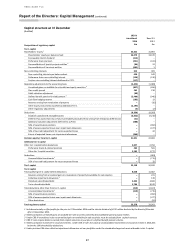
Treasury bills, other eligible bills and debt securities in the group’s insurance manufacturing companies
(Audited)
2014
2013
Strong
Good/
Satisfactory
Total
2
Strong
Good/
Satisfactory
Total
2
£m
£m
£m
£m
£m
£m
Financial assets designated at fair value1
446
135
581
418
151
569
– treasury and other eligible bills
3
-
3
–
–
–
– debt securities
443
135
578
418
151
569
Financial investments
9,350
1,522
10,872
9,286
1,650
10,936
– treasury and other similar bills
–
–
–
–
–
–
– debt securities
9,350
1,522
10,872
9,286
1,650
10,936
At 31 December
9,796
1,657
11,453
9,704
1,801
11,505
1 Impairment is not measured for debt securities designated at fair value, as assets in such portfolios are managed according to movements in
fair value, and the fair value movement is taken directly through the income statement.
2 Total is the maximum exposure to credit risk on the treasury bills, other eligible bills and debt securities in the group’s insurance companies.
Credit risk also arises when assumed insurance risk is
ceded to reinsurers. The split of liabilities ceded to
reinsurers and outstanding reinsurance recoveries,
analysed by credit quality, is shown below. The group’s
exposure to third parties under the reinsurance
agreements is included in this table.
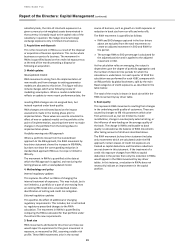
Reinsurers’ share of liabilities under insurance contracts
(Audited)
Strong
Good/
Satisfactory
Past due not
impaired
Total
1,2
£m
£m
£m
£m
Unit-linked insurance contracts
47
–
–
47
Non-linked insurance contracts
140
2
–
142
At 31 December 2014
187
2
–
189
Reinsurance debtors
4
–
4
8
Unit-linked insurance contracts
43
–
–
43
Non-linked insurance contracts
447
2
–
449
At 31 December 2013
490
2
–
492
Reinsurance debtors
7
–
–
7
1 No amounts reported within Reinsurers’ share of liabilities under insurance contracts were classified as sub-standard or impaired.
2 Total is the maximum exposure to credit risk in respect of reinsurers’ share of liabilities under insurance contracts.
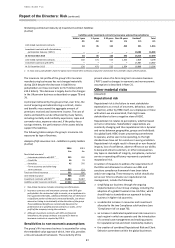
Liquidity risk of insurance operations
The following tables show the expected undiscounted
cash flows for insurance contract liabilities and the
remaining contractual maturity of investment contract
liabilities at 31 December 2014. The liquidity risk
exposure is borne in conjunction with policyholders for
the majority of the business, and wholly borne by
the policyholder in the case of unit-linked business.
The profile of the expected maturity of the insurance
contracts at 31 December 2014 remained comparable
with 2013.
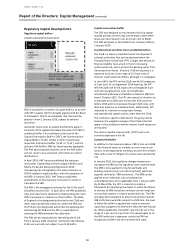
Expected maturity of insurance contract liabilities
(Audited)
Expected cash flows (undiscounted)
Within 1 year
1-5 years
5-15 years
Over 15 years
Total
£m
£m
£m
£m
£m
Non-linked insurance1
22
145
211
149
527
Unit-linked insurance
89
279
400
337
1,105
At 31 December 2014
111
424
611
486
1,632
Non-linked insurance1
44
234
394
393
1,065
Unit-linked insurance
271
839
973
697
2,780
At 31 December 2013
315
1,073
1,367
1,090
3,845
1 Non-linked insurance includes remaining non-life business.