HSBC 2014 Annual Report Download - page 141
Download and view the complete annual report
Please find page 141 of the 2014 HSBC annual report below. You can navigate through the pages in the report by either clicking on the pages listed below, or by using the keyword search tool below to find specific information within the annual report.-
 1
1 -
2
-
3
-
4
-
5
-
6
-
7
-
8
-
9
-
10
-
11
-
12
-
13
-
14
-
15
-
16
-
17
-
18
-
19
-
20
-
21
-
22
-
23
-
24
-
25
-
26
-
27
-
28
-
29
-
30
-
31
-
32
-
33
-
34
-
35
-
36
-
37
-
38
-
39
-
40
-
41
-
42
-
43
-
44
-
45
-
46
-
47
-
48
-
49
-
50
-
51
-
52
-
53
-
54
-
55
-
56
-
57
-
58
-
59
-
60
-
61
-
62
-
63
-
64
-
65
-
66
-
67
-
68
-
69
-
70
-
71
-
72
-
73
-
74
-
75
-
76
-
77
-
78
-
79
-
80
-
81
-
82
-
83
-
84
-
85
-
86
-
87
-
88
-
89
-
90
-
91
-
92
-
93
-
94
-
95
-
96
-
97
-
98
-
99
-
100
-
101
-
102
-
103
-
104
-
105
-
106
-
107
-
108
-
109
-
110
-
111
-
112
-
113
-
114
-
115
-
116
-
117
-
118
-
119
-
120
-
121
-
122
-
123
-
124
-
125
-
126
-
127
-
128
-
129
-
130
-
 131
131 -
 132
132 -
 133
133 -
 134
134 -
 135
135 -
 136
136 -
 137
137 -
 138
138 -
 139
139 -
 140
140 -
 141
141 -
 142
142 -
 143
143 -
 144
144 -
 145
145 -
 146
146 -
 147
147 -
 148
148 -
 149
149 -
 150
150 -
 151
151 -
152
-
153
-
154
-
155
-
156
-
157
-
158
-
159
-
160
-
161
-
162
-
163
-
164
-
165
-
166
-
167
-
168
-
169
-
170
-
171
-
172
-
173
-
174
-
175
-
176
-
177
-
178
-
179
-
180
-
181
-
182
-
183
-
184
-
185
-
186
-
187
-
188
-
189
-
190
-
191
-
192
-
193
-
194
-
195
-
196
-
197
-
198
-
199
-
200
 |
 |

HSBC BANK PLC
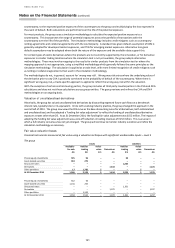
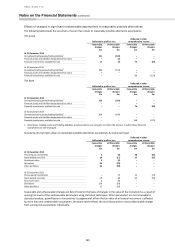
Notes on the Financial Statements (continued)
139
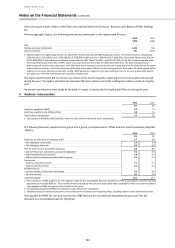
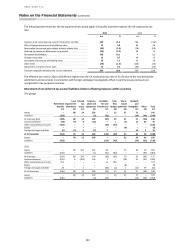
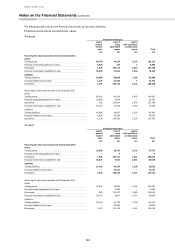
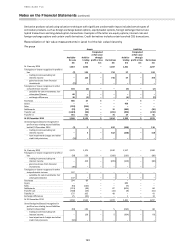
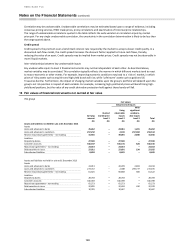
The following table sets out the financial instruments by fair value hierarchy
Financial instruments carried at fair value
The group
Valuation techniques
Level 1
quoted
market
price
Level 2
using
observable
inputs
Level 3
with significant
unobservable
inputs
Total
£m
£m
£m
£m
Recurring fair value measurement at 31 December 2014
Assets
Trading assets
83,749
44,225
2,153
130,127
Financial assets designated at fair value
6,618
276
5
6,899
Derivatives
1,949
184,173
1,614
187,736
Financial investments: available-for-sale
56,996
17,652
1,546
76,194
Liabilities
Trading liabilities
22,669
58,638
1,293
82,600
Financial liabilities at fair value
1,107
21,440
5
22,552
Derivatives
1,935
185,122
1,221
188,278
Recurring fair value measurement at 31 December 2013
Assets
Trading assets
83,241
49,294
1,562
134,097
Financial assets designated at fair value
10,818
5,843
–
16,661
Derivatives
323
135,844
1,072
137,239
Financial investments: available-for-sale
55,737
17,640
1,653
75,030
Liabilities
Trading liabilities
42,064
48,417
1,361
91,842
Financial liabilities at fair value
4,078
29,958
–
34,036
Derivatives
1,236
134,819
1,297
137,352
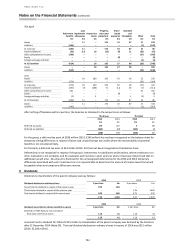
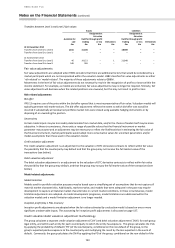
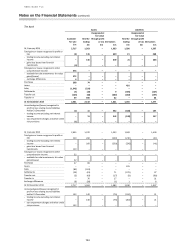
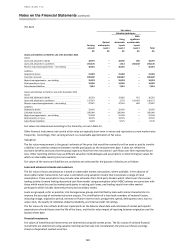
The bank
Valuation techniques
Level 1
quoted
market
price
Level 2
using
observable
inputs
Level 3
with significant
un-observable
inputs
Total
£m
£m
£m
£m
Recurring fair value measurement at 31 December 2014
Assets
Trading assets
56,908
38,717
2,132
97,757
Financial assets designated at fair value
–
9
–
9
Derivatives
1,900
156,711
1,621
160,232
Financial investments: available-for-sale
36,276
9,801
2,361
48,438
Liabilities
Trading liabilities
11,433
46,370
1,236
59,039
Financial liabilities at fair value
–
16,127
–
16,127
Derivatives
1,920
158,145
1,377
161,442
Recurring fair value measurement at 31 December 2013
Assets
Trading assets
47,843
51,881
1,563
101,287
Financial assets designated at fair value
–
3,983
–
3,983
Derivatives
283
111,257
1,083
112,623
Financial investments: available-for-sale
33,724
8,607
2,717
45,048
Liabilities
Trading liabilities
18,346
42,778
1,290
62,414
Financial liabilities at fair value
–
22,006
–
22,006
Derivatives
1,214
112,129
1,367
114,710